Quantitative Response and Quantitative Explanatory Variables
Introduction
Bivariate data refers to situations where you have a quantitative response variable and a quantitative explanatory variable.
As with other data summaries, we can describe the relationship between 2 quantitative variables numerically and visually.
By the end of this lesson, you should be able to:
Create scatterplots for 2 quantitative variables R
Describe what the correlation coefficient, \(r\), quantifies
Calculate \(r\) using the cor() function
Two datasets will be used to illustrate these concepts. The first contains self-reported confidence in mathematics and test scores. The second contains eruption duration and time between eruptions of Old Faithful geyser in Yellowstone National Park.
# Load the libraries and datalibrary(tidyverse)library(mosaic)library(rio)library(car)geyser <-import('https://byuistats.github.io/BYUI_M221_Book/Data/OldFaithful.xlsx')names(geyser)
[1] "Duration" "Wait" "Source"
math <-import('https://byuistats.github.io/BYUI_M221_Book/Data/MathSelfEfficacy.xlsx')names(math)
To look at the relationship between 2 quantitative variables, we use scatter plots. This plots a point on an (x,y) axis, where y is the response and x is the explanatory variable.
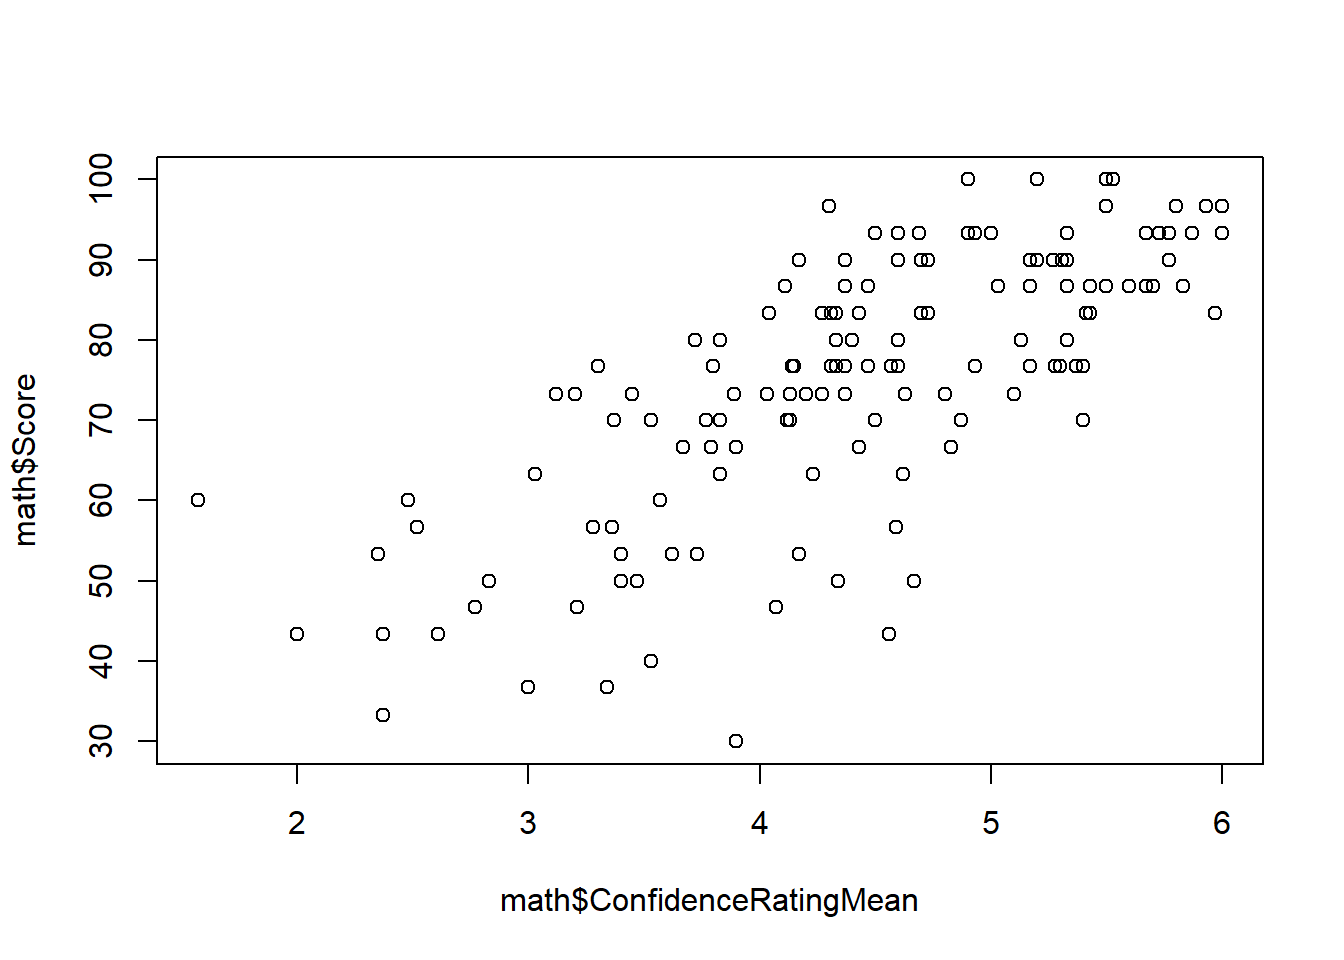
To create a simple scatter plot, we use the plot() function and the same formula we’ve used for boxplot() and favstats(): data$response ~ data$explanatory. Only this time, the explanatory variable must be quantitative. Create a scatter plot for the math confidence data.
QUESTION: What is the response variable? ANWSER:
QUESTION: What is the explanatory variable? ANSWER:
plot(math$Score ~ math$ConfidenceRatingMean)
Numerical Summary: Correlation Coefficient
We say that 2 variables are “correlated” if as one variable changes, the other tends to change as well. However, the word “correlation” means something more than how we use the word “correlated” in everyday use.
KEY DEFINITION: Correlation is a mathematical quantity describing the strength and direction of a linear relationship between 2 quantitative variables.
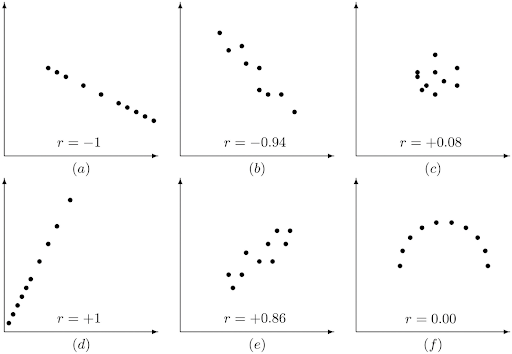
The Correlation Coefficient is called \(r\). It is a number between -1 and 1, with -1 being a perfect, negative correlation (ie. a straight line) and 1 being a perfect, positive correlation.
See the images below for scenarios for different correlation coefficients:
Notice the panel in the bottom right corner. There is clearly a perfect relationship between \(x\) and \(y\), yet \(r=0\). This is because \(r\) measures the strength and direction of a linear relationship. If the relationship is not linear, then \(r\) can still be zero.
We check for linearity by observation of the scatter plots.
Question: What does the correlation coefficient, \(r\), quantify? Answer:
Question: What does it mean if the correlation coefficient, \(r\), is negative? Answer:
Math Confidence
Scatter plot
Review the scatter plot showing the relationship between students’ self reported confidence rating and test score.
plot(math$Score ~ math$ConfidenceRatingMean)
Question: Before calculating the Correlation Coefficient, r, describe in words the direction and strength of the relationship. (strength, direction) Answer:
Question: Does it look linear? Answer:
Question: What’s your best guess at, \(r\) based on the scatterplot? Answer:
Calculate the Correlation Coefficient, \(r\):
cor(math$Score ~ math$ConfidenceRatingMean)
[1] 0.7278648
Question: How far off was your guess? Answer:
Old Faithful
Scatter plot
Make a scatter plot showing the relationship between wait time and the duration of the next eruption.
Deciding which is the response variable in this data is a bit tricky. To remain consistent, assume that the wait time between eruptions explains how long the subsequent eruption will last.
Create a scatterplot of the relationship between wait time and duration. Remember to use the formula y ~ x
Question: Before calculating the Correlation Coefficient, r, describe in words the direction and strength of the relationship. Answer:
Question: What’s your best guess at, \(r\) based on the scatter plot? Answer: