
R Commands
“For the things we have to learn before we can do them, we learn by doing them.”
― Aristotle, The Nicomachean Ethics
Getting Started
Hover your mouse here to
begin. Good work!
This book
requires that you interact with it to learn. Hovering is the first step.
Now click right here on
these words to get started.
? The Help Command
Getting help in R is easy.
Usage
?something
- This command pulls up the help file for whatever you write in the
place of
something.
Examples
Click to view. Hover to learn.
? The quick way to
access the help function in R.
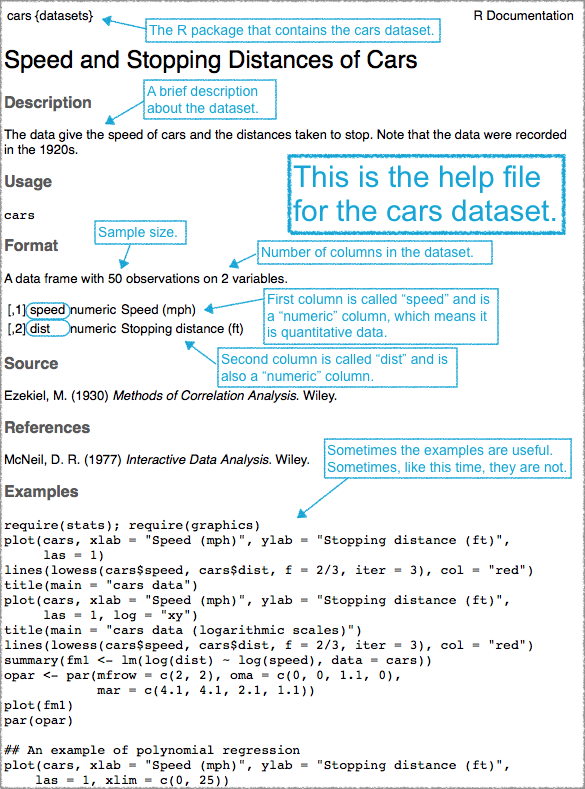
cars The name of a dataset can be typed to
open the help file for that dataset.
Press Enter to run the code.
Click to Show Output Click to View
Output.
? The quick way to
access the help function in R.
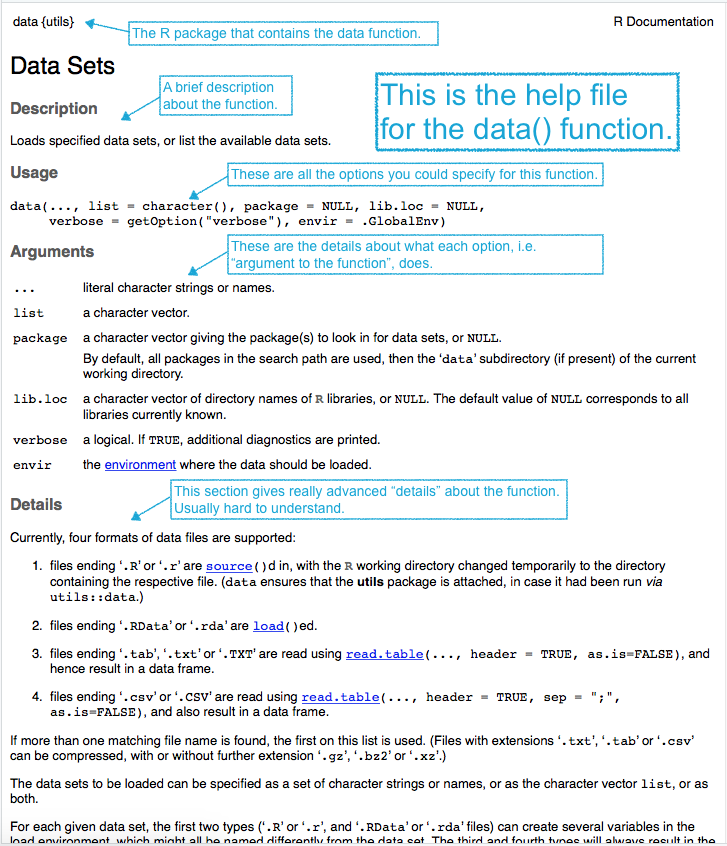
data The name of an R function, like
data can also be used to open the help file for that
function.
Press Enter to run the code.
Click to Show Output Click to View
Output.
? The quick way to
access the help function in R.
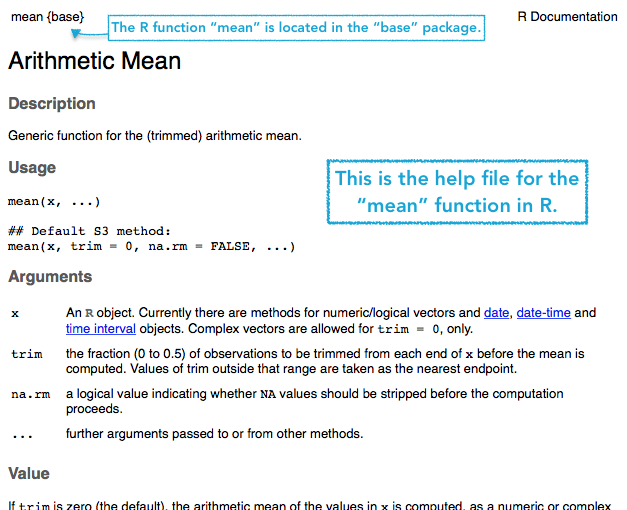
mean The mean function computes
the mean of a column of quantitative data. Typing the name of an R
function, like mean can also be used to open the help file
for that function.
Press Enter to run the code.
Click to Show Output Click to View
Output.
$ The Selection Operator
Once you have a dataset, you need to be able to access columns from it.
Usage
DataSetName$ColumnName
- The
$operator allows you to access the individual columns of a dataset.
Tip: think of the data set as a “store”
from which you “purchase” a column using “money”:
$.
Example Code
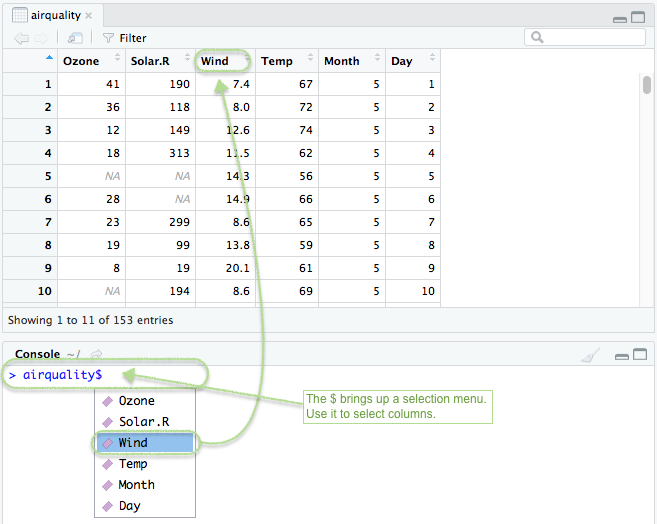
airquality The
airqaulity dataset. This could be the name of any dataset
instead of airquality. $ Grabs the column, or
variable, from the dataset to be used. This is typically used when
computing say the mean (or other statistic) of a single column of the
data. Wind The name of any column of the dataset can be
entered after the dollar sign. In the airquality dataset, this includes:
Ozone, Solar.R, Wind,
Temp, Month, or Day as shown by
View(airquality).
Press Enter to run the code.
Click to Show Output Click to View
Output.
This allows you to compute things about that column, like the mean or standard deviation.
mean( The
mean function computes the mean of a column of quantitative
data. airquality The airquality dataset. This could be
the name of any dataset instead of airquality.
$ Grabs the
column, or variable, from the dataset to be used. This is typically used
when computing say the mean (or other statistic) of a single column of
the data. Wind The name of any column of the dataset can be
entered after the dollar sign. In the airquality dataset, this includes:
Ozone, Solar.R, Wind,
Temp, Month, or Day as shown by
View(airquality). )
Closing parenthesis to the mean()
function.
Press Enter to run the code.
Click to Show Output Click to View
Output.
sd( The
sd function computes the standard deviation of a column of
quantitative data. airquality
The airqaulity dataset. This
could be the name of any dataset instead of
airquality. $ Grabs the column, or variable, from the dataset to
be used. This is typically used when computing say the mean (or other
statistic) of a single column of the data. Wind The name of any
column of the dataset can be entered after the dollar sign. In the
airquality dataset, this includes: Ozone,
Solar.R, Wind, Temp,
Month, or Day as shown by
View(airquality). )
Closing parenthesis to the sd()
function.
Press Enter to run the code.
Click to Show Output Click to View
Output.
See Numerical Summaries for
more stats functions like mean() and sd().
<- The Assignment Operator
Being able to save your work is important!
Usage Keyboard Shortcut: Alt
-
NameYouCreate <- some R commands
<-(Less than symbol<with a hyphen-) is called the assignment operator and lets you store the results of thesome R commandsinto an object calledNameYouCreate.NameYouCreateis any name that begins with a letter, but can use numbers, periods, and underscores thereafter. To use spaces in the name, you must use `your Name` encased in back-ticks, but this is not recommended.
Example Code
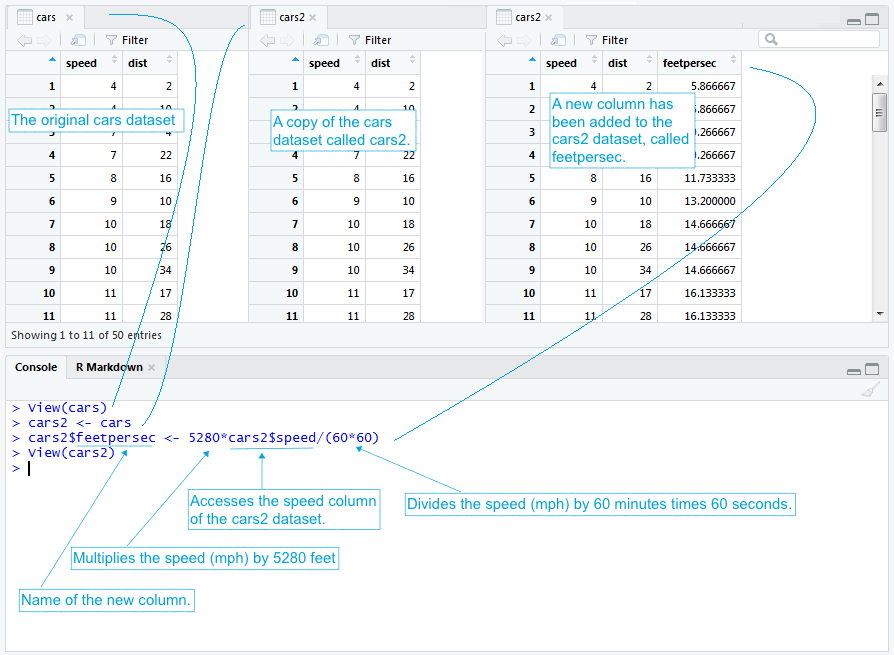
cars2 First we
name the object we are creating. In this case, we are making a copy of
the cars dataset, so it is logical to call it cars2, but it
could be bob, c2 or any name you wanted to
use. Just be careful to not use names that are already in use!
<- The
<- assignment operator will take whatever is on the
right hand side and save it into the name written on the left hand side.
cars In this case the cars dataset is being
copied to cars2 so that we can change cars2
without changing the original cars dataset.
Press Enter to run the code.
cars2 The
new copy of the cars dataset that we just created
$ftpersec The
$ selection operator can be used to create a new column in
a dataset when used with the <- assignment operator.
<- The <- assignment operator will
take the results of the right-hand-side and save them into the name on
the left-hand-side. cars2$speed *
5280 / 3600 This calculation converts the
miles per hour of the cars2 speed column into
feet per seconds because there are 5280 feet in a mile and 60 minutes in
an hour and 60 seconds in a minute.
View(cars2) The cars2 dataset now contains a 3rd
column called feetpersec. Compare this to the original
cars dataset to see how it changed. Click to Show
Output Click to View Output.
c( ) The Combine Function
Think of this function as the “back-pack” function, just like putting different books into one back-pack.
Usage
c(value 1, value 2, value 3, ... )
- The
c( )function combinesvaluesinto a single object called a “vector”. values 1, 2, 3, ...can be numbers or characters, i.e., words, but must be all of one type or the other.
Example Code
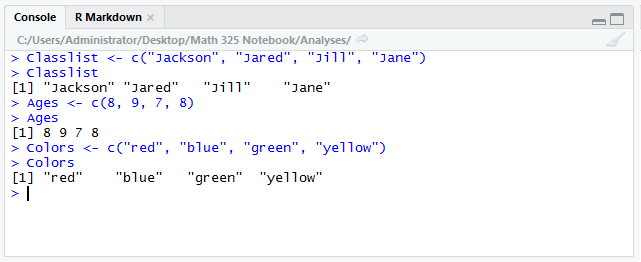
Classlist <- Classlist is a new object being
created using the assignment operator <- that will
contain the four names listed above. c( The combine function
c( ) is being used in this case to group character values
representing names of students into a single object named “Classlist”.
“Jackson”, “Jared”, “Jill”,
“Jane”) These are the values we are grouping
into the object named Classlist.
Press Enter to run the code.
Ages <- The
assignment operator <- is being used to create the
object called Ages that will contain the ages of each
student on the Classlist. c( The R function “c()”
allows us to group together values in order to save them into an object.
8, 9, 7, 8 The values, separated by comma’s, that are being
grouped together. In this case, numbers are being grouped together.
) Always close off your functions in R with a closing
parathesis.
Press Enter to run the code.
Colors <- The
assignment operator <- is being used to create the
object called Colors that will have one color for each
student on the Classlist. c( The R function “c()”
allows us to group together values in order to save them into an object.
“red”, “blue”, “green”, “yellow”
The values, separated by comma’s, that are
being grouped together. In this case, characters are being grouped
together. ) Always close off your functions in R with a closing
parathesis.
Press Enter to run the code.
Click to Show Output Click to View
Output.
table( )
This is a way to quickly count how many times each value occurs in a column or columns.
Usage
table(NameOfDataset$columnName)
table(NameOfDataset$columnName1, NameOfDataset$columnName2)
- The
table( )function counts how many times eachvaluein a column of data occurs. NameOfDatasetis the ane of a data set, likecarsorairqualityorKidsFeet.columnNameis the name of a column from the data set.columnName1andcolumnName2are two different names of columns from the data set.
Example Code
speedCounts <-
speedCounts is a new object
being created using the assignment operator <- that will
contain the counts of how many times each “speed” occurs in the
cars data set speed column. table( The table function
table( ) is being used in this case to count how many times
each speed occurs in the cars data set speed column.
cars This is
the name of the data set. $ The $ is used to access a given column from the
data set. speed This is the name of the column we are interested in
from the cars data set. ) Always close off your functions in R with a closing
parathesis.
speedCounts Typing the name of an object will print the results
to the screen.
Press Enter to run the code.
Click to Show Output Click to View
Output.
library(mosaic) library(mosaic) is needed to access
the KidsFeet data set that is used in this example. If you don’t have
the mosaic library, you will need to run
install.packages("mosaic") to install it first. From then
on, you can open mosaic to use it with the command library(mosaic). You
need only install packages once. You must library them each time you
wish to use them.
birthdays
<-
birthdays is a new object being
created using the assignment operator <- that will
contain the counts of how many birthdays occur in each month for each
gender in the KidsFeet dataset.
table( The table function
table( ) is being used in this case to count how many
birthdays occur in each month for children of each gender.
KidsFeet This
is the name of the data set. $
The $ is used to access a given column from
the data set. sex This is the name of the column we are interested in
becoming the rows of our final table. , Comma separating the two
columns of the data set you want to table. KidsFeet This is the name
of the data set. $ The $ is used to access a given column from the
data set. birthmonth This is the name of the column we are interested in
becoming the columns of our final table. ) Always close off your
functions in R with a closing parathesis.
birthdays Typing the name
of an object will print the results to the screen.
Press Enter to run the code.
Click to Show Output Click to View
Output.
filter( )
Used to reduce a dataset to a smaller set of rows than the original dataset contained.
Usage
filter(NameOfDataset, columnName filteringRules)
filter()is the function that filters out certain rows of the dataset.NameOfDatasetis the name of a dataset, likecarsorairqualityorKidsFeet.columnNameis the name of one of the columns from the dataset. You can usecolnames(NameOfDataset)orView(NameOfDataset)to see the names.filteringRulesconsists of some Logical Expression (see table below) that selects only the rows from the original dataset that meet the criterion.
| Filtering Rule | Logical Expression |
|---|---|
| Equals one “thing” | columnName == something |
| Equals Any Of Several “things” | columnName %in%
c(something1,something2,...) |
| Not Equal (one thing) | columnName != something |
| Not Equals Any of (several things) | !columnName %in%
c(something1,something2,...) |
| Less Than | columnName < value |
| Less Then or Equal to | columnName <= value |
| Greater Than | columnName > value |
| Greater Than or Equal to | columnName >= value |
| AND | expression1 &
expression2 |
| OR | expression1 |
expression2 |
Equals NA |
is.na(columnName) |
Not NA |
!is.na(columnName) |
Example Code
library(tidyverse) The tidyverse library is needed to access the
filter function used in the following example codes.
library(mosaic) The mosaic library is needed to access the KidsFeet
data set used in the following example codes.
Equals one “thing”…
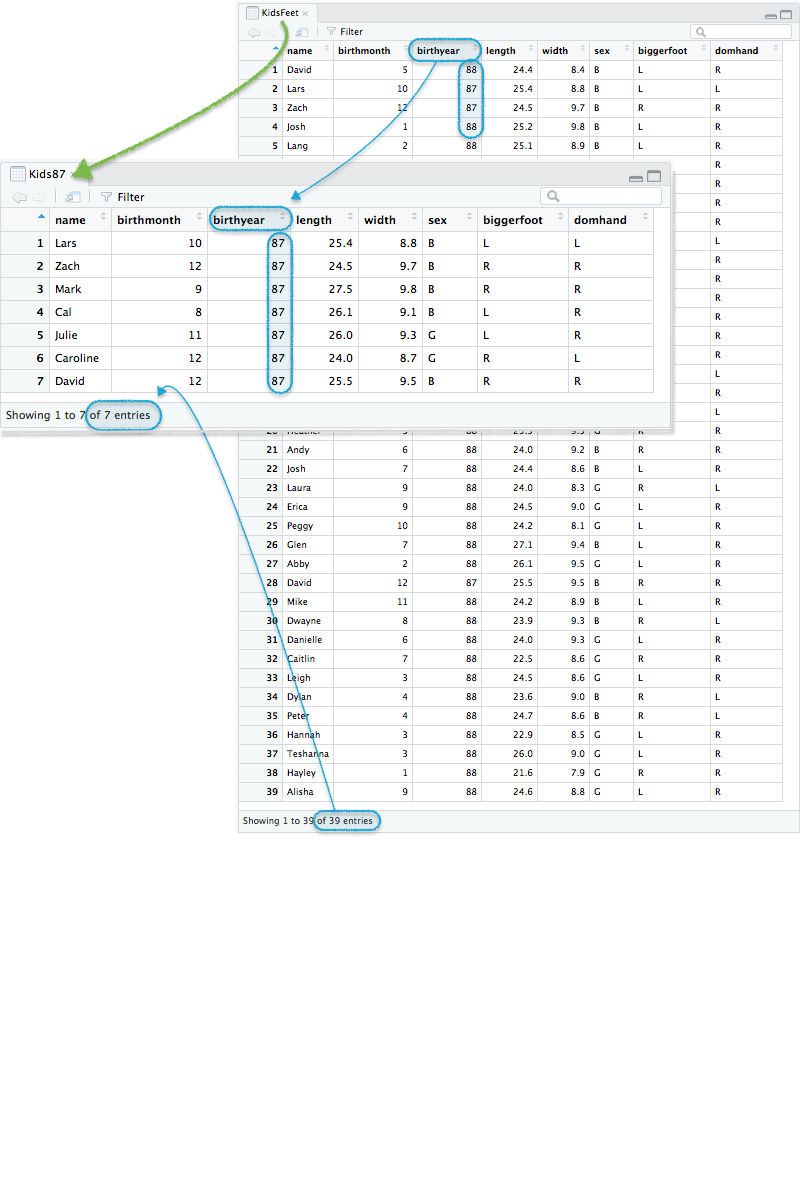
Kids87 <- Kids87 is a name we made up. The assignment
operator <- will save the reduced version of the
KidsFeet dataset created by the filter(...)
function into this name.
filter(KidsFeet, “filter” is a function
from library(tidyverse) that reduces the number of rows in the KidsFeet
dataset by filtering according to certain criteria. Click on this code
to see the original and filtered datasets. birthyear A quantitative
column of the KidsFeet dataset that we want to use to reduce the
dataset. == 87 This “filtering rule” filters the data down to just
those children who had a birthyear equal to 87. ) Always close off your
functions in R with a closing parathesis.
Press Enter to run the code.
Click to Show Output Click to View
Output.
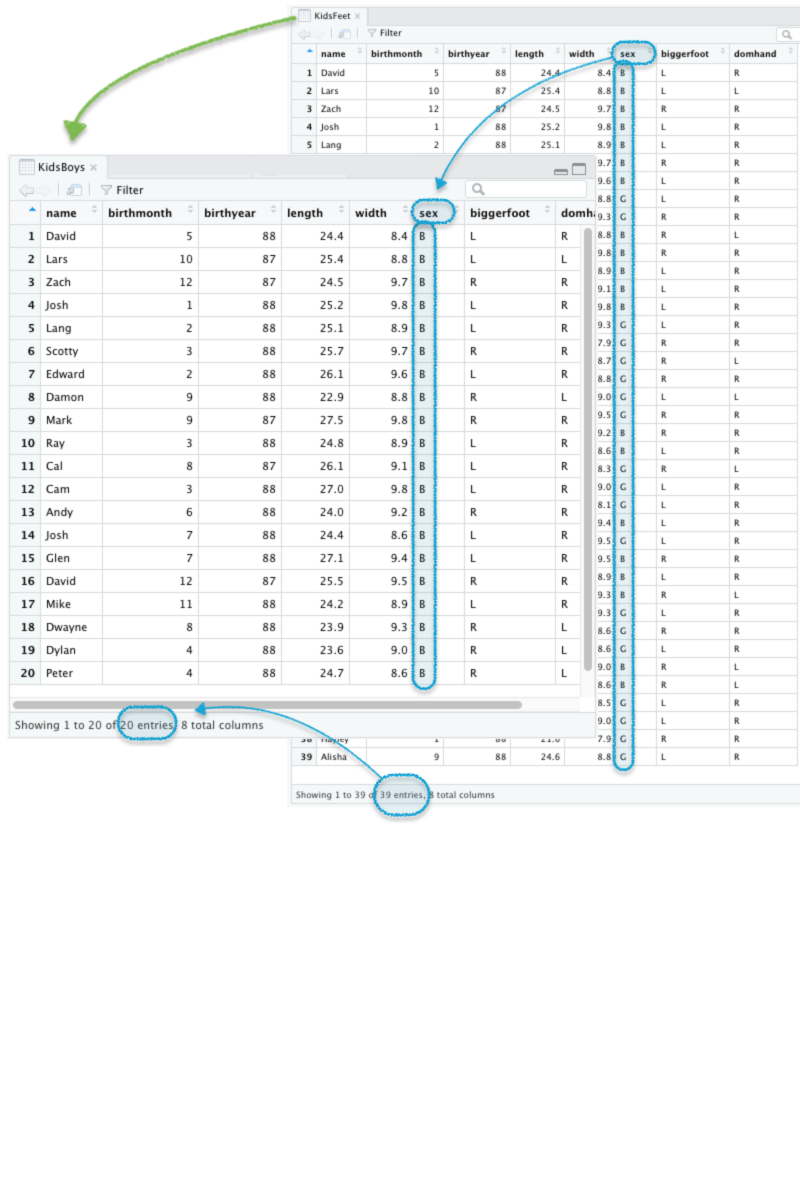
KidsBoys <- KidsBoys is a name we made up. The assignment
operator <- will save the reduced version of the
KidsFeet dataset created by the filter(...)
function into this name.
filter(KidsFeet, “filter” is a function
from library(tidyverse) that reduces the number of rows in the KidsFeet
dataset by filtering according to certain criteria. Click on this code
to see the original and filtered datasets. sex A categorical column of
the KidsFeet dataset that we want to use to reduce the dataset.
== “B” This
“filtering rule” filters the data down to just those children who are
boys. Words must be quoted “B” but values are just typed
directly. ) Always close off your functions in R with a closing
parathesis.
Press Enter to run the code.
Click to Show Output Click to View
Output.
Equals Any of Several “things”…
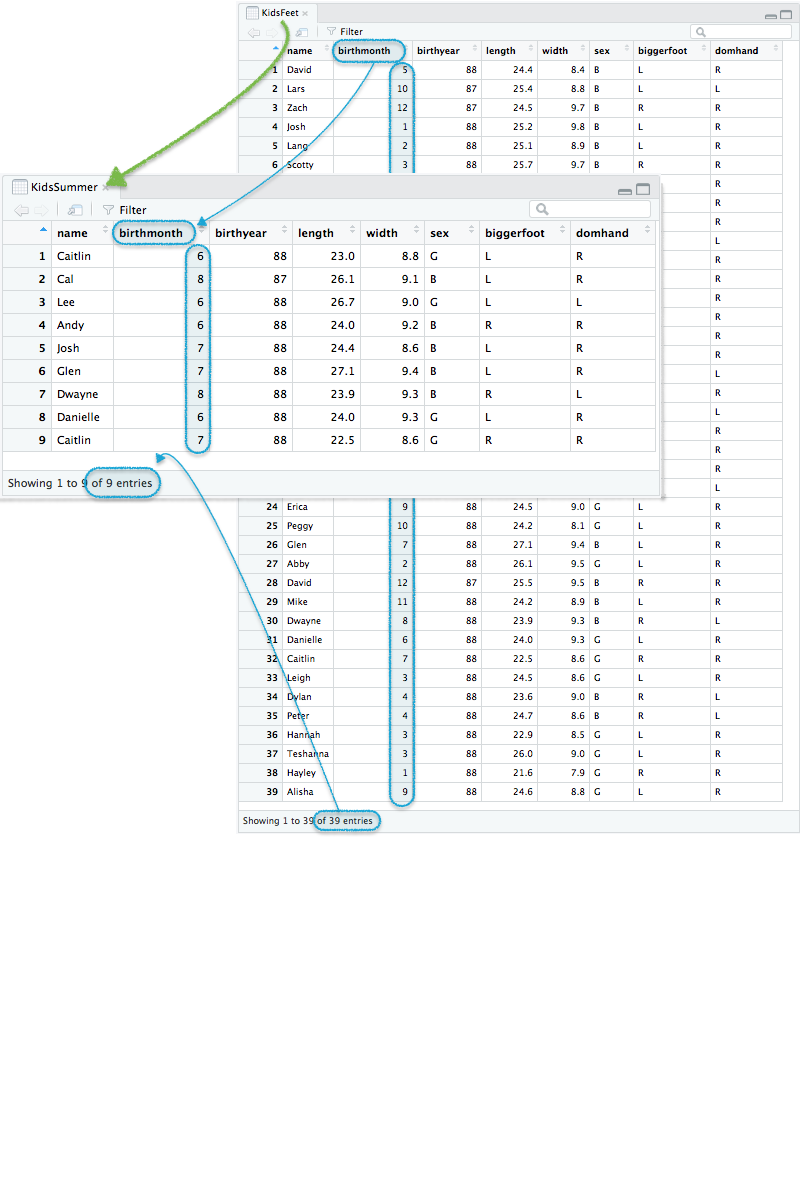
KidsSummer <- KidsSummer is a name we made up. The assignment
operator <- will save the reduced version of the
KidsFeet dataset created by the filter(...)
function into this name.
filter(KidsFeet, “filter” is a function
from library(tidyverse) that reduces the number of rows in the KidsFeet
dataset by filtering according to certain criteria. Click on this code
to see the original and filtered datasets. birthmonth The column of
the KidsFeet dataset that we want to use to reduce the dataset.
%in% c(6,7,8) This is the “filtering rule”. It will filter the
data down to just those children who were born during the summer, i.e.,
birthmonth equal to either 6, 7, or 8. Notice how the c( ) function is
being used to combine the values of 6, 7, and 8 together into a single
list of numbers. ) Always close off your functions in R with a closing
parathesis.
Press Enter to run the code.
Click to Show Output Click to View
Output.
Does not equal one thing…
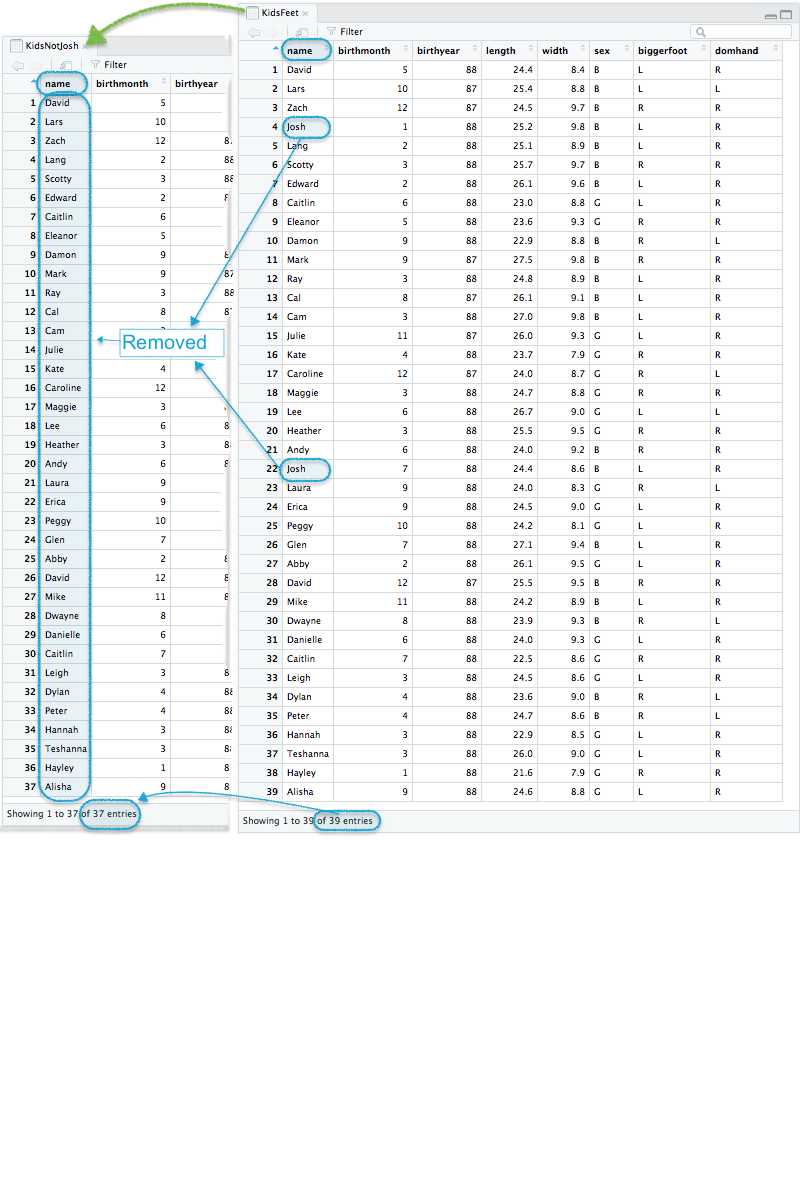
KidsNotJosh <- KidsNotJosh is a name we made up. The assignment
operator <- will save the reduced version of the
KidsFeet dataset created by the filter(...)
function into this name.
filter(KidsFeet, “filter” is a function
from library(tidyverse) that reduces the number of rows in the KidsFeet
dataset by filtering according to certain criteria. Click on this code
to see the original and filtered datasets. name The column of the
KidsFeet dataset that we want to use to reduce the dataset.
!= “Josh” This is the “filtering rule”. It will filter the
data down to just those children who are NOT named “Josh”. In this case,
it removed just two students who were named “Josh”. ) Always close off your
functions in R with a closing parathesis.
Press Enter to run the code.
Click to Show Output Click to View
Output.
Less than…
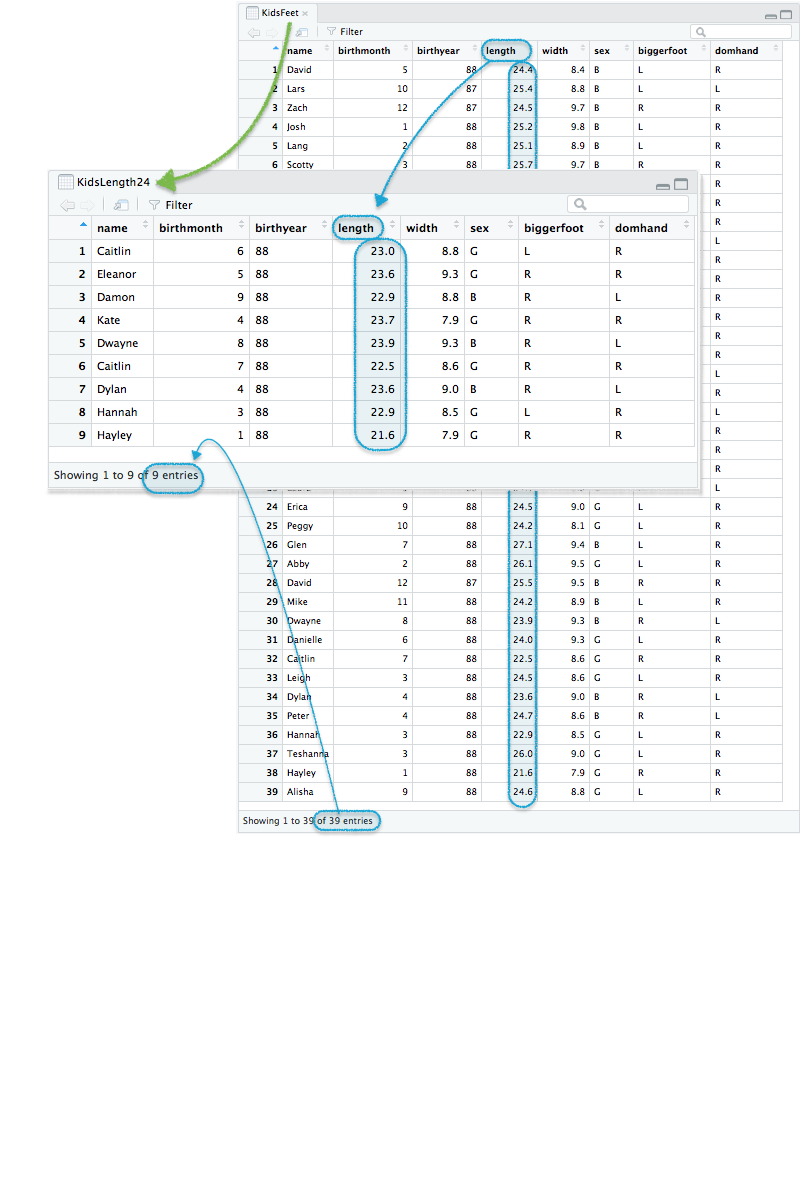
KidsLength24 <- KidsLength24 is a name we made up. The assignment
operator <- will save the reduced version of the
KidsFeet dataset created by the filter(...)
function into this name.
filter(KidsFeet, “filter” is a function
from library(tidyverse) that reduces the number of rows in the KidsFeet
dataset by filtering according to certain criteria. Click on this code
to see the original and filtered datasets. length The column of the
KidsFeet dataset that we want to use to reduce the dataset.
< 24 This
is the “filtering rule”. It will filter the data down to just those
children who have a foot length less than 24 cm. ) Always close off your
functions in R with a closing parathesis.
Press Enter to run the code.
Click to Show Output Click to View
Output.
Less than or equal to…
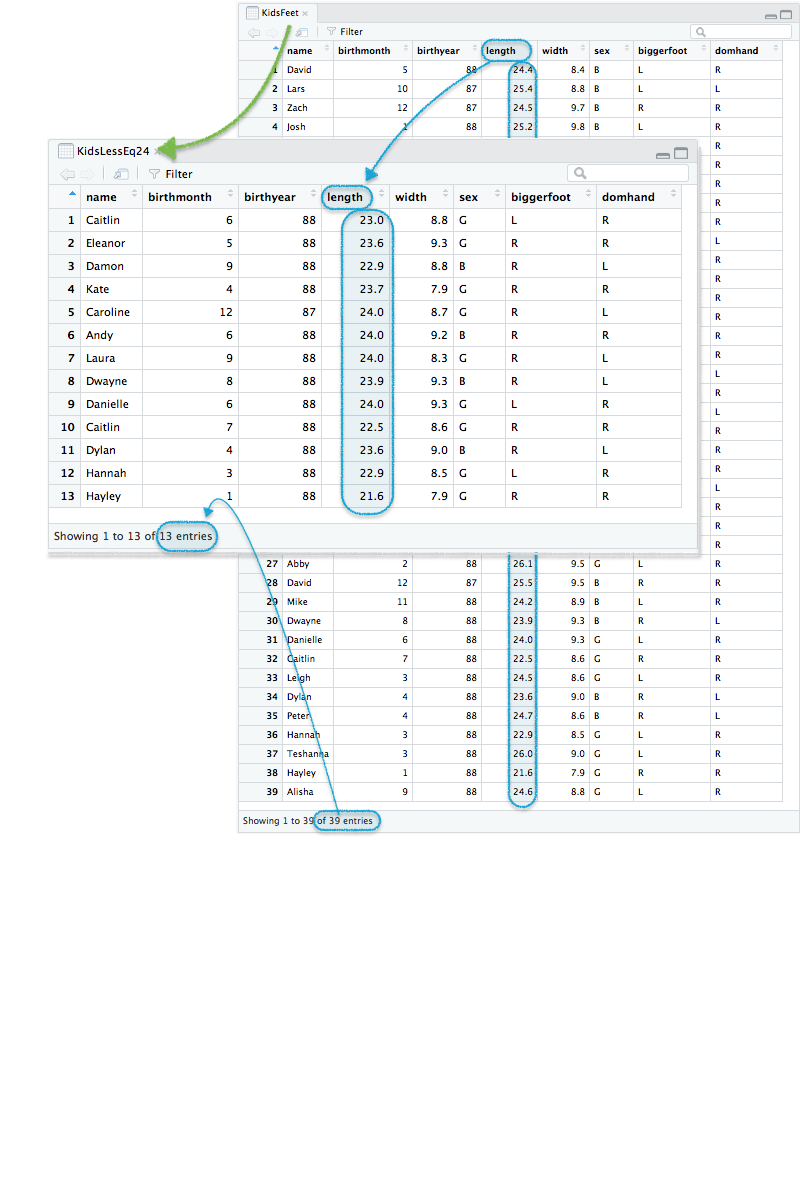
KidsLessEq24 <- KidsLessEq24 is a name we made up. The assignment
operator <- will save the reduced version of the
KidsFeet dataset created by the filter(...)
function into this name.
filter(KidsFeet, “filter” is a function
from library(tidyverse) that reduces the number of rows in the KidsFeet
dataset by filtering according to certain criteria. Click on this code
to see the original and filtered datasets. length The column of the
KidsFeet dataset that we want to use to reduce the dataset.
<= 24 This
is the “filtering rule”. It will filter the data down to just those
children who have a foot length less than or equal to 24 cm.
) Always close
off your functions in R with a closing parathesis.
Press Enter to run the code.
Click to Show Output Click to View
Output.
Greater than…
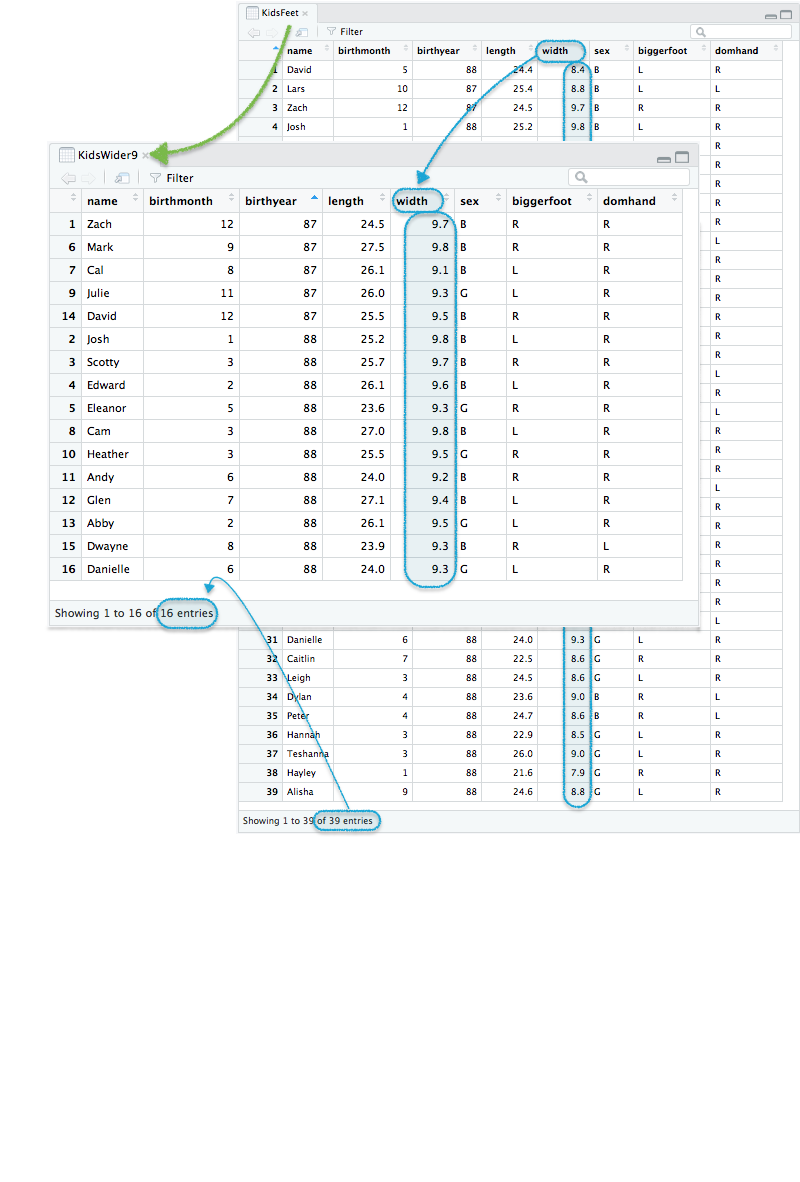
KidsWider9 <- KidsNotJosh is a name we made up. The assignment
operator <- will save the reduced version of the
KidsFeet dataset created by the filter(...)
function into this name.
filter(KidsFeet, “filter” is a function
from library(tidyverse) that reduces the number of rows in the KidsFeet
dataset by filtering according to certain criteria. Click on this code
to see the original and filtered datasets. width The column of the
KidsFeet dataset that we want to use to reduce the dataset.
> 9 This
is the “filtering rule”. It will filter the data down to just those
children who have a foot width greater than 9 cm. ) Always close off your
functions in R with a closing parathesis.
Press Enter to run the code.
Click to Show Output Click to View
Output.
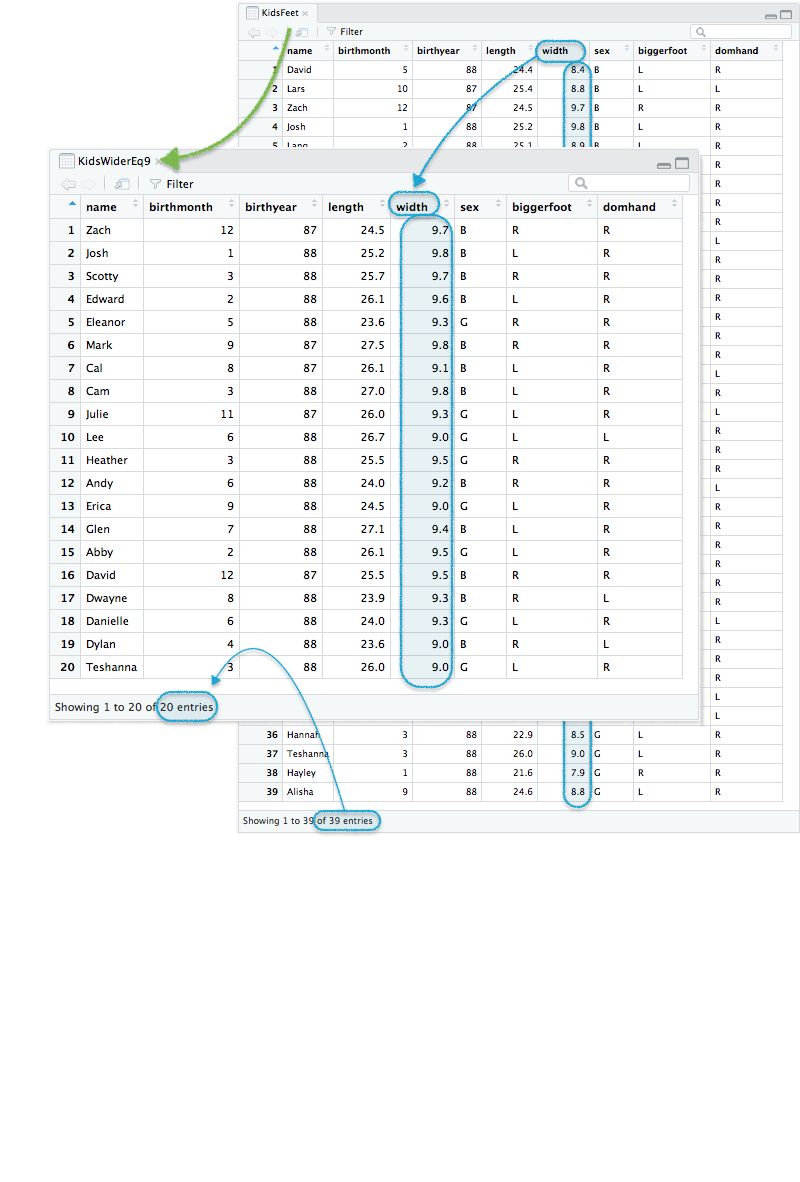
Greater than or equal to…
KidsWiderEq9 <- KidsWiderEq9 is a name we made up. The assignment
operator <- will save the reduced version of the
KidsFeet dataset created by the filter(...)
function into this name.
filter(KidsFeet, “filter” is a function
from library(tidyverse) that reduces the number of rows in the KidsFeet
dataset by filtering according to certain criteria. Click on this code
to see the original and filtered datasets. width The column of the
KidsFeet dataset that we want to use to reduce the dataset.
>= 9 This
is the “filtering rule”. It will filter the data down to just those
children who have a foot width greater than or equal to 9 cm.
) Always close
off your functions in R with a closing parathesis.
Press Enter to run the code.
Click to Show Output Click to View
Output.
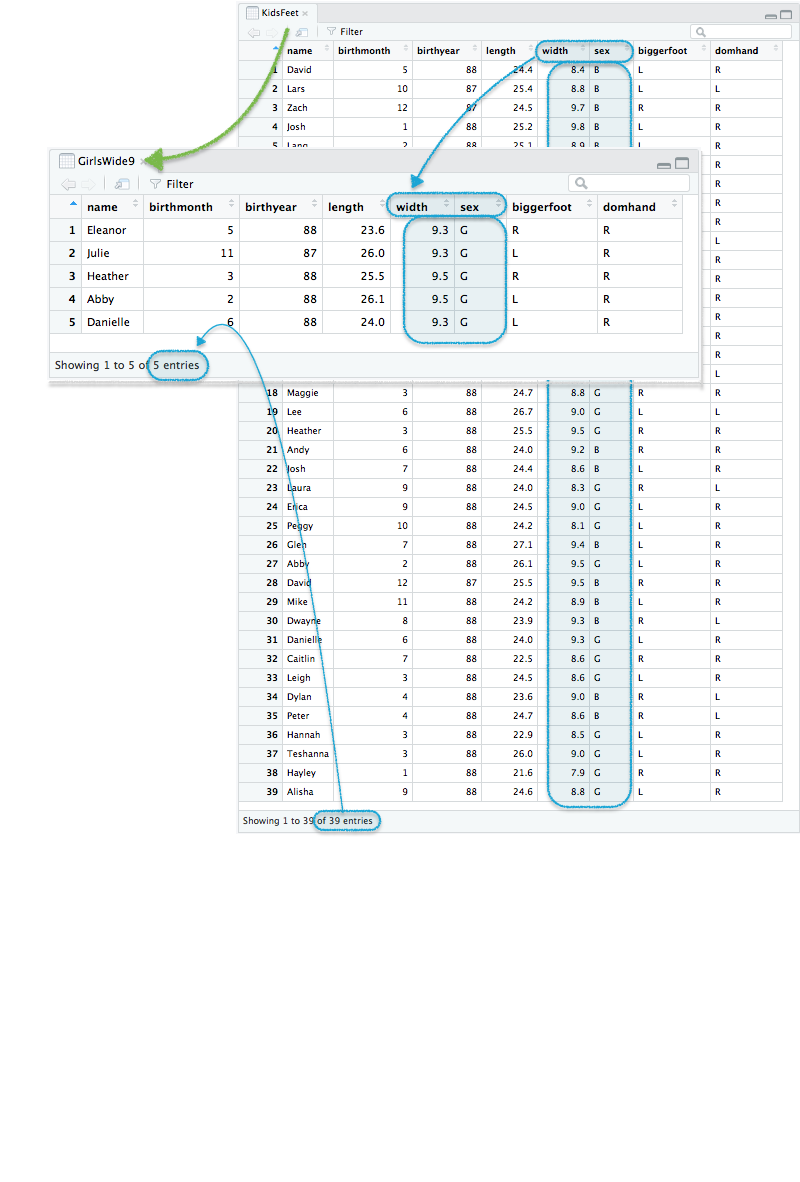
The “and” statement…
GirlsWide9 <- GirlsWide9 is a name we made up. The assignment
operator <- will save the reduced version of the
KidsFeet dataset created by the filter(...)
function into this name.
filter(KidsFeet, “filter” is a function
from library(tidyverse) that reduces the number of rows in the KidsFeet
dataset by filtering according to certain criteria. Click on this code
to see the original and filtered datasets. sex The first column of the
KidsFeet dataset that we want to use to reduce the dataset.
== “G” This
is the first “filtering rule”. It will filter the data down to just
those children who are girls.
& The & is the AND statement. It
joins to filtering criteria together into a single criteria where both
conditions must be met. In this case, it ensures we get only girls with
foot widths greater than 9 cm.
width The second column of the KidsFeet
dataset that we want to use to reduce the dataset. > 9 This is the second
“filtering rule”. It will filter the data down to just those children
who have a foot width greater than 9 cm. ) Always close off your
functions in R with a closing parathesis.
Press Enter to run the code.
Click to Show Output Click to View
Output.
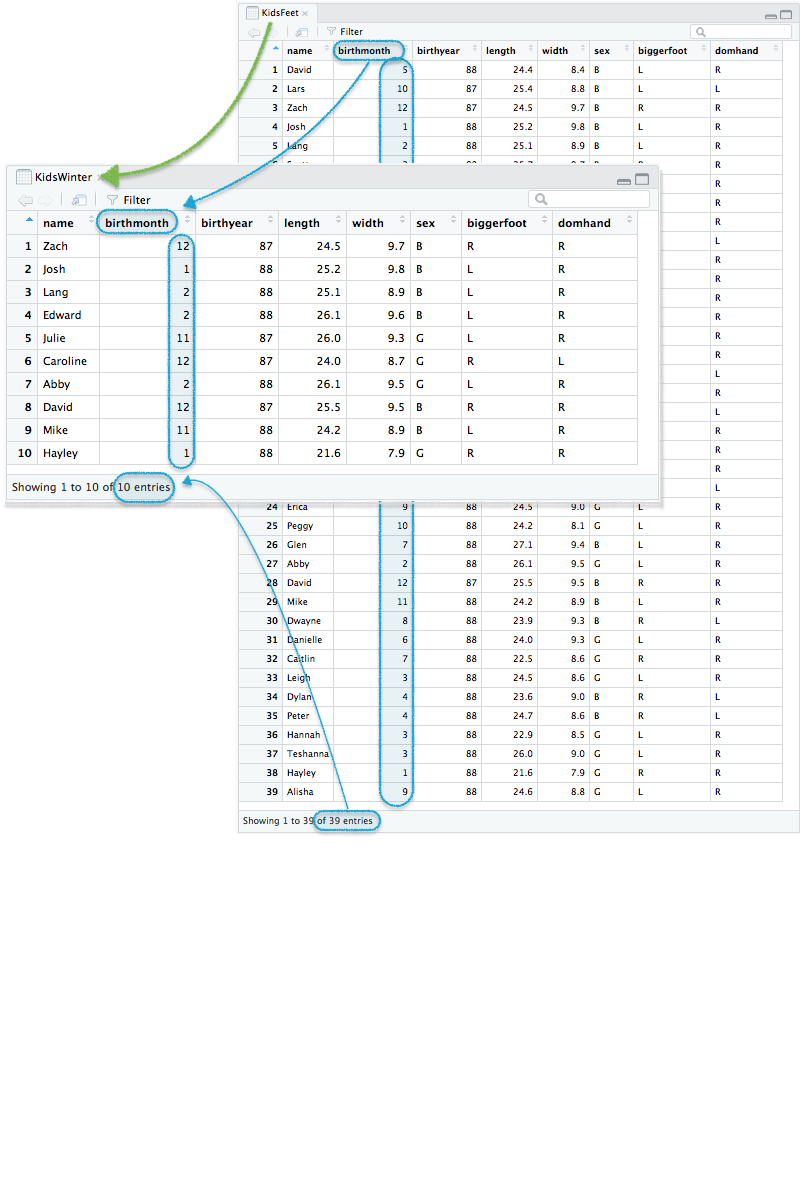
The “or” statement…
KidsWinter <- KidsWinter is a name we made up. The assignment
operator <- will save the reduced version of the
KidsFeet dataset created by the filter(...)
function into this name.
filter(KidsFeet, “filter” is a function
from library(tidyverse) that reduces the number of rows in the KidsFeet
dataset by filtering according to certain criteria. Click on this code
to see the original and filtered datasets. birthmonth The first column
of the KidsFeet dataset that we want to use to reduce the
dataset. <= 2 This is the first “filtering rule”. It will filter
the data down to just those children who are born in January or
February. | The | is the OR statement. It joins to filtering
criteria together into a single criteria where either condition gives us
what we want. In this case, it keeps any child born in January,
February, November, or December.
birthmonth The second column of the KidsFeet
dataset that we want to use to reduce the dataset. In this case, it is
the same as the first column.
>= 11 This is the second “filtering
rule”. It will filter the data down to just those children who are born
in November or December. ) Always close off your functions in R with a closing
parathesis.
Press Enter to run the code.
Click to Show Output Click to View
Output.
select( )
Used to select out certain columns from a dataset.
Usage
select(NameOfDataset, listOfColumnNames)
select( )is the function that selects out certain columns of the dataset.NameOfDatasetis the name of a dataset, likecarsorairqualityorKidsFeet.listOfColumnNamesis a vector of names of columns from the dataset, usually supplied inside a combinec(...)statement.
Example Code
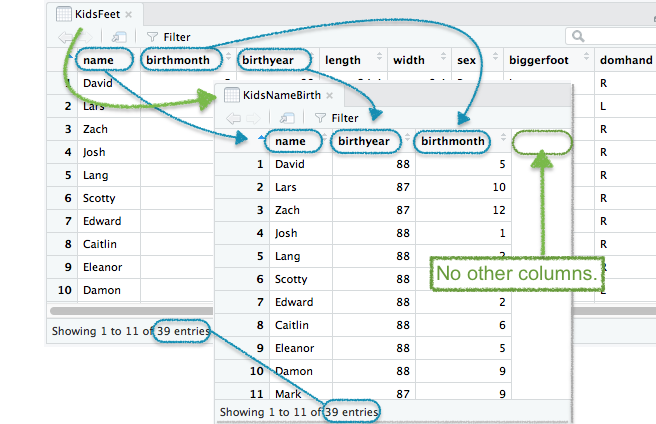
KidsNameBirth <- KidsNameBirth is a name we made up. The assignment
operator <- will save the reduced version of the
KidsFeet dataset created by the select(...)
function into this name.
select(KidsFeet, “select” is a function
from library(tidyverse) that selects out specified columns from the
original dataset in the order specified. c(name, birthyear, birthmonth) The columns of the KidsFeet dataset that we want to
select out of the original dataset. Notice how the concatenation
function c(...) is used to list out the columns we
want. ) Always close off your functions in R with a closing
parathesis.
Press Enter to run the code.
Click to Show Output Click to View
Output.
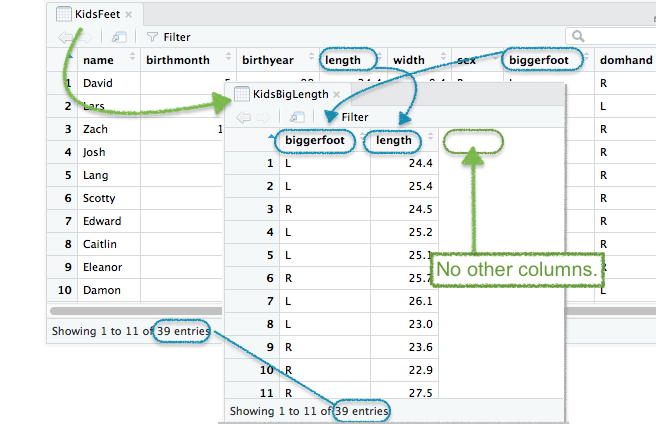
KidsBigLength <- KidsBigLength is a name we made up. The assignment
operator <- will save the reduced version of the
KidsFeet dataset created by the select(...)
function into this name.
select(KidsFeet, “select” is a function
from library(tidyverse) that selects out specified columns from the
original dataset in the order specified. c(biggerfoot, length) The
columns of the KidsFeet dataset that we want to select out of the
original dataset. The order in which columns are selected is the order
in which they are placed in the new data set. ) Always close off your
functions in R with a closing parathesis.
Press Enter to run the code.
Click to Show Output Click to View
Output.
%>% The Pipe Operator
Just like the pipes in your kitchen sink, the pipe operator takes “water from the sink” and “sends it down to somewhere else.”
Usage Keyboard Shortcut: Ctrl
Shift M
NameOfDataset %>%
some R commands that follow on the next line
%>%, the pipe operator, is created by typing percent symbols%on both sides of a greater than symbol>. It lets you take whatever is on the left of the symbol and “pipe it down into”some R commandsthat follow on the next line.NameOfDatasetis the name of a dataset, likecarsorairqualityorKidsFeet.
Note: you should load
library(tidyverse) before using the %>%
operator.
Example Code
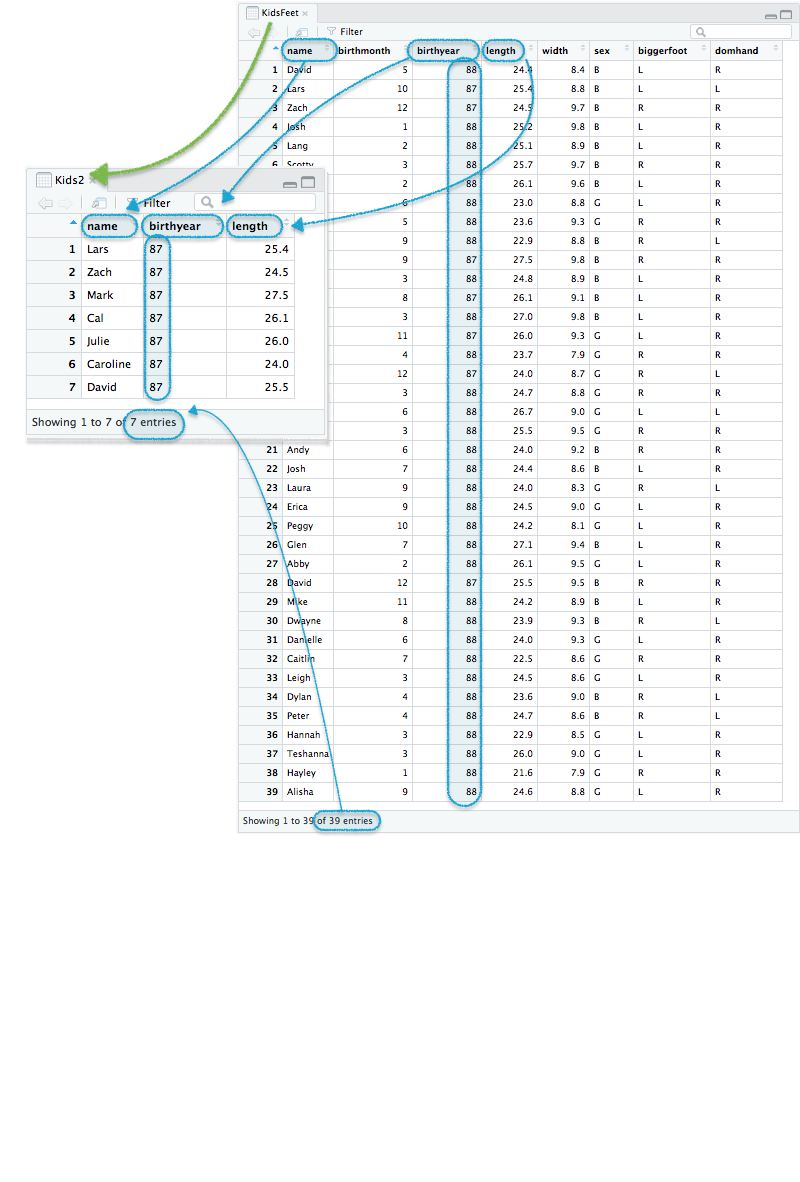
Kids2 <- This
provides a name for the new reduced version of the KidsFeet
dataset that is going to be created by the combined use of
filter(...) and select(...).
KidsFeet KidsFeet is a dataset found in
library(mosaic). Click on this code to View the dataset and
the resulting Kids2 dataset.
%>% The pipe operator that will send the
KidsFeet dataset down inside of the code on the following
line.
filter( “filter” is a function from library(tidyverse) that
allows us to reduce the number of rows in the KidsFeet dataset by
filtering according to certain criteria. birthyear Represents the
column of data that we want to use to reduce the rows of the
dataset. == 87 This is the “filtering rule”. It will filter the
data down to just those children who had a birthyear equal to 87.
) Always close
off your functions in R with a closing parathesis. %>% The pipe operator
that will send the filtered version of the KidsFeet dataset
down inside of the code on the following line.
select( “select” is a
function from library(tidyverse) that selects out specified columns from
the current dataset in the order specified. c(name, birthyear, length) The columns of the filtered KidsFeet dataset that
we want to select. Notice how the concatenation function
c(...) is used to list out the columns we want.
) Always close
off your functions in R with a closing parathesis.
Press Enter to run the code.
Click to Show Output Click to View
Output.
summarise( ) and group_by( )
Compute numerical summaries on data or on groupings within the data.
Usage
NameofDataset %>%
summarise(nameYouLike = some_stats_function(columnName))
OR
NameofDataset %>%
group_by(columnGroupsName) %>%
summarise(nameYouLike = some_stats_function(columnName))
NameOfDatasetis the name of a dataset, likecarsorairqualityorKidsFeet.%>%is the pipe operator that “pipes data” down into R commands on the next line.group_by(...)is an R function fromlibrary(tidyverse)that groups data according to a specified column (or columns).summarise(...)is an R function fromlibrary(tidyverse)that computes numerical summaries on data or groups of data.columnGroupsNameis the name of a column that represents qualitative (categorical) data. This column is used to separate the dataset into little datasets, one “little dataset” for each group or category in thecolumnGroupsNamecolumn.nameYouLikeis just that. Some name you come up with.some_stats_function(...)is a stats function likemean(...),sd(...),n(...)or so on.columnNameis the name of a column from the dataset that you want to compute numerical summaries on.
Example Code
KidsFeet KidsFeet is a dataset found in
library(mosaic).
%>% The pipe operator that will send the
KidsFeet dataset down inside of the code on the following
line.
summarise( “summarise” is a function from library(tidyverse)
that allows us to compute numerical summaries on data.
aveLength A
name we came up with that will store the results of the numerical
summary. = mean(length) This computes the mean(...) of the
length column from the KidsFeet dataset.
) Always close
off your functions in R with a closing parathesis.
Press Enter to run the code.
Click to Show Output Click to View
Output.
KidsFeet KidsFeet is a dataset found in
library(mosaic).
%>% The pipe operator that will send the
KidsFeet dataset down inside of the code on the following
line.
summarise( “summarise” is a function from library(tidyverse)
that allows us to compute numerical summaries on data.
aveLength A
name we came up with that will store the results of the numerical
summary. = mean(length), This computes the mean(...) of the
length column from the KidsFeet dataset.
sdLength A name we came up with that will store the results
of the numerical summary. =
sd(length), This computes the
sd(...) of the length column from the KidsFeet
dataset.
sampleSize A name we came up with that will
store the results of the numerical summary. = n( ) This computes the
n(...), or sample size, of the length column
from the KidsFeet dataset. ) Always close off your functions in R with a closing
parathesis.
Press Enter to run the code.
Click to Show Output Click to View
Output.
KidsFeet KidsFeet is a dataset found in
library(mosaic).
%>% The pipe operator that will send the
KidsFeet dataset down inside of the code on the following
line.
group_by( “group_by” is a function from library(tidyverse)
that allows us to split the dataset up into “little groups” according to
the column specified. sex “sex” is a column from the KidsFeet dataset that
records the gender of each child.
) Always close off your functions in R with a
closing parathesis. %>% The pipe operator that will send the grouped
according to gender version of the KidsFeet dataset down
inside of the code on the following line.
summarise( “summarise”
is a function from library(tidyverse) that allows us to compute
numerical summaries on data.
aveLength A name we came up with that will
store the results of the numerical summary. = mean(length), This
computes the mean(...) of the length column
from the KidsFeet dataset.
sdLength A name we came up with
that will store the results of the numerical summary.
= sd(length), This computes the sd(...) of the
length column from the KidsFeet dataset.
sampleSize A name we came up with that will store the results
of the numerical summary. = n( )
This computes the n(...), or
sample size, of the length column from the KidsFeet
dataset. ) Always close off your functions in R with a closing
parathesis.
Press Enter to run the code.
Click to Show Output Click to View
Output.
For more uses of summarise(...) and
group_by(...) see the Example codes on the various “R
Instructions” of the Numerical
Summaries page.
mutate( )
Transform a column or add a new column of data to a data set.
Usage
NameofDataset %>%
mutate(nameYouLike = some_transformation)
NameOfDatasetis the name of a dataset, likecarsorairqualityorKidsFeet.%>%is the pipe operator that “pipes data” down into R commands on the next line.nameYouLikeis just that. Some name you come up with that will be the name of a new column in the dataset.some_transformationis just that. See the example codes for ideas.
Example Code
mtcars2 <- mtcars2 is a new dataset we are
creating that will contain all of mtcars data set along
with a couple new columns we are creating. mtcars mtcars
is a dataset found in base R. Typing View(mtcars) and
?mtcars in the console will help you learn more about the
dataset. %>% The pipe operator that will send the
mtcars dataset down inside of the code on the following
line.
mutate( “mutate” is a function from library(tidyverse) that
allows us to transform columns of data.
cyl_factor = as.factor(cyl), “cyl_factor” is a name we came up with that will
store the results of the transformation of the “cyl” column. Here we are
simply converting the “cyl” column from type numeric to a factor.
Treating the “cyl” column as a factor could be useful in certain
situations.
weight =
wt * 1000 “weight” is a name we came up with
that will store the results of the transformation of the “wt” column.
Taking a closer look with ?mtcars shows us that wt is in
1000 lbs. Here we are just multiplying each row in the column by
1000.
) Closing parenthesis for the mutate(…)
function.
Press Enter to run the code.
Click to Show Output Click to View
Output.
Kids3 <- Kids3 is a new dataset we are creating
that will contain all of KidsFeet data set along with a
couple new columns we are creating. KidsFeet KidsFeet is a dataset found in
library(mosaic).
%>% The pipe operator that will send the
KidsFeet dataset down inside of the code on the following
line.
mutate( “mutate” is a function from library(tidyverse) that
allows us to transform columns of data.
season = case_when( “season” is a name we came up with that will store
the results of the transformation of the “birthmonth” column. The
case_when(…) function from library(tidyverse) allows us to perform more
complicated transformations with columns.
birthmonth %in% c(12,1,2) ~ “Winter”, The body of case_when(…) is of the form
logical expression ~ "newValueName". This statement says
that we want the values in the column “birthmonth” that are equal to 12,
1, and 2 to be assigned to the value “Winter” in the new “season”
column.
birthmonth
%in% c(3,4,5) ~ “Spring”, The body of
case_when(…) is of the form
logical expression ~ "newValueName". This statement says
that we want the values in the column “birthmonth” that are equal to 3,
4, and 5 to be assigned to the value “Spring” in the new “season”
column.
birthmonth
%in% c(6,7,8) ~ “Summer”, The body of
case_when(…) is of the form
logical expression ~ "newValueName". This statement says
that we want the values in the column “birthmonth” that are equal to 6,
7, and 8 to be assigned to the value “Summer” in the new “season”
column.
birthmonth
%in% c(9,10,11) ~ “Fall” The body of
case_when(…) is of the form
logical expression ~ "newValueName". This statement says
that we want the values in the column “birthmonth” that are equal to 9,
10, and 11 to be assigned to the value “Fall” in the new “season”
column.
) Closing parenthesis of the case_when(…)
function.
) Closing parenthesis for the mutate(…)
function.
Press Enter to run the code.
Click to Show Output Click to View
Output.
Kids4 <- Kids4 is a new dataset we are creating
that will contain all of KidsFeet data set along with a
couple new columns we are creating. KidsFeet KidsFeet is a dataset found in
library(mosaic).
%>% The pipe operator that will send the
KidsFeet dataset down inside of the code on the following
line.
mutate( “mutate” is a function from library(tidyverse) that
allows us to transform columns of data.
lengthIN = length / 2.54, “lengthIN” is a name we came up with that will
store the results of the transformation of the “length” column. This is
just converting the length data from cm to inches.
widthIN = width / 2.54,
“widthIN” is a name we came up with that will
store the results of the transformation of the “width” column. This is
just converting the width data from cm to inches.
lengthSplit = ifelse(length
< median(length),
“Under 50th Percentile”,
“50th Percentile or Greater”), “lengthSplit” is a name we came up with that will
store the results of the ifelse(…) function. The ifelse(…) function in
this case is being used to split the length column by the median of that
column. The ifelse(…) function is of the form ifelse( Logical Condition
, valueIfConditionTrue, valueIfConditionFalse).
gender = case_when( “gender” is a name we came up with that will store
the results of the transformation of the “sex” column. The case_when(…)
function from library(tidyverse) allows us to perform more complicated
transformations with columns.
sex == “B” ~ “Boy”, The body of
case_when(…) is of the form
logical expression ~ "newValueName". This part of the
case_when(…) function is being used to change the value of “B” to
“Boy”.
sex == “G” ~
“Girl” The body of case_when(…) is of the
form logical expression ~ "newValueName". This part of the
case_when(…) function is being used to change the value of “G” to
“Girl”.
) Closing parenthesis for the case_when(…)
function.
) Closing parenthesis for the mutate(…)
function.
Press Enter to run the code.
Click to Show Output Click to View
Output.
airquality2 <- airquality is a new dataset we are
creating that will contain all of the airquality data set
along with a new column we are creating. airquality airquality is a dataset found in base
R. Typing View(airquality) and ?airquality in
the console will help you learn more about the dataset.
%>% The
pipe operator that will send the KidsFeet dataset down
inside of the code on the following line.
mutate( “mutate” is a
function from library(tidyverse) that allows us to transform columns of
data. Month_Full = “Month_Full” is a name we came up with that will
store the results of the transformation of the “Month” column.
month( month(…) is from library(lubridate) and changes the
“Month” column from type integer to type datetime. Month, “Month” is the
“Month” column from airquality.
label = TRUE, “label = TRUE” tells month(…)
to change the month numbers to abbreviated month names.
abbr = FALSE
“abbr = FALSE” changes the abbreviated month names to the full month
names. ) Closing parenthesis for the month(…)
function. ) Closing parenthesis for the mutate(…)
function.
Press Enter to run the code.
Click to Show Output Click to View
Output.
Other case_when( ) Uses
case_when(length > 25 & width > 9 ~ "Long and Wide",
          length < 25 & width > 9 ~ "Short and Wide",
          length > 25 & width < 9 ~ "Long and Thin",
          length < 25 & width < 9 ~ "Short and Thin")
replace_na( ) Function
newDataName <- dataName %>%
  mutate(newColumnName = replace_na(columnName, value))
as.numeric( ) Function
newDataName <- dataName %>%
  mutate(newColumnName = as.numeric(columnName))
as.character( ) Function
newDataName <- dataName %>%
  mutate(newColumnName = as.character(columnName))
as.factor( ) Function
newDataName <- dataName %>%
  mutate(newColumnName = as.factor(columnName))
Pull Out Numbers Only with parse_number(…)
newDataName <- dataName %>%
  mutate(newColumnName = parse_number(columnName))

# So stuff like c("500+", "20", "80 ", "15a") would become
# just c(500, 20, 80, 15). That's nice!
arrange( )
Arrange data by a certain column, or columns, i.e. “sort” the data.
Usage
NameofDataset %>%
arrange(columnName1)
Note: arrange(columnName1, columnName2, ...) is also
possible.
NameOfDatasetis the name of a dataset, likecarsorairqualityorKidsFeet.%>%is the pipe operator that “pipes data” down into R commands on the next line.arrange(...)is an R function fromlibrary(tidyverse)that arranges a data set by order for the column given.columnName1is the name of a column from the dataset that you want to compute numerical summaries on.columnName2is the name of a column from the dataset that you want to compute numerical summaries on....implies that you can arrange by as many columns as you want.
Example Code
KidsFeet KidsFeet is a dataset found in
library(mosaic).
%>% The pipe operator that will send the
KidsFeet dataset down inside of the code on the following
line.
arrange( “arrange” is an R function from
library(tidyverse) that arranges a data set by order for
the column given. birthmonth birthmonth is the name of one of the columns of the
KidsFeet data set. Specifying this name will cause the data to be sorted
by birthmonth from 1 to 12. )
Always close off your functions in R with a
closing parathesis.
Press Enter to run the code.
Click to Show Output Click to View
Output.
KidsFeet KidsFeet is a dataset found in
library(mosaic).
%>% The pipe operator that will send the
KidsFeet dataset down inside of the code on the following
line.
arrange( “arrange” is an R function from
library(tidyverse) that arranges a data set by order for
the column given. desc( This causes the arranging to be done in descending
order (highest to lowest).
birthmonth birthmonth is the name of one of
the columns of the KidsFeet data set. Specifying this name will cause
the data to be sorted by birthmonth from 1 to 12. ) Always close off your
functions in R with a closing parathesis. ) Always close off your
functions in R with a closing parathesis.
Press Enter to run the code.
Click to Show Output Click to View
Output.
pander( )
Makes output of most commands “beautiful”.
Usage
library(pander) then…
pander(someCode)
OR
someCode %>%
pander( )
Note: pander(stuff, caption="Some useful caption", ...)
is also possible.
someCodeis exactly that, some coding you have done that creates output that you want displayed nicely.%>%is the pipe operator that “pipes data” down into R commands on the next line.pander(...)is an R function fromlibrary(pander)that makes most R output look nice....other useful commands likesplit.table=Inf.
Example Code
pander( pander is an R function that makes
output look nice.
table(KidsFeet$sex, KidsFeet$birthmonth), Code that makes a table of how many boys and girls
were born in each month of the year. caption=“Counts of Birthdays by Month” The caption=” ” command is very useful for giving
your output a small title. ) Always close off your functions in R with a closing
parathesis.
Press Enter to run the code.
Click to Show Output Click to View
Output.
KidsFeet KidsFeet is a dataset found in
library(mosaic).
%>% The pipe operator that will send the
KidsFeet dataset down inside of the code on the following
line.
group_by( “group_by” is a function from library(tidyverse)
that allows us to split the dataset up into “little groups” according to
the column specified. sex “sex” is a column from the KidsFeet dataset that
records the gender of each child.
) Always close off your functions in R with a
closing parathesis. %>% The pipe operator that will send the grouped
according to gender version of the KidsFeet dataset down
inside of the code on the following line.
summarise( “summarise”
is a function from library(tidyverse) that allows us to compute
numerical summaries on data.
aveLength A name we came up with that will
store the results of the numerical summary. = mean(length), This
computes the mean(...) of the length column
from the KidsFeet dataset.
sdLength A name we came up with
that will store the results of the numerical summary.
= sd(length), This computes the sd(...) of the
length column from the KidsFeet dataset.
sampleSize A name we came up with that will store the results
of the numerical summary. = n( )
This computes the n(...), or
sample size, of the length column from the KidsFeet
dataset. ) Always close off your functions in R with a closing
parathesis. %>% The pipe operator that will send the
KidsFeet dataset down inside of the code on the following
line.
pander( The pander function will make the output of the
above code look nice.
caption=“Doesn’t that look nice?”) Always
close off your functions in R with a closing parathesis.
Press Enter to run the code.
Click to Show Output Click to View
Output.