
Getting Started Tutorial
Student: “How do I learn R?”
Teacher: “By using it.”
Student: “But I don’t know how to use it.”
Teacher: “Just try it anyway. Suddenly you’ll understand.”
Most people that are new to using the “R Software” ask the question, “How do I learn R?” The answer is simple: “start using it.” Really. Seriously. Just start using it, even when you have no idea what you are doing, and suddenly you will start to learn R. So, here we go. The more you use it, the more you will know.
This textbook (the “Statistics-Notebook”) follows a simple learning model:
- Hover your mouse over
codeYes, just like that. By hovering over “Codes” you will get instructions on what that code does. to read about it. - Click on a
line of codeHovering is a good start, try clicking on this one. to see what it does. - Try typing the code into RStudio yourself to actually start learning R. (This is the most important step! Avoid copying and pasting codes, and type them instead. The more you type codes yourself, even though it is slow and prone to mistakes, the more you will learn.)

In summary, the most successful students in Math 325 follow the pattern:

Example Codes
For each of the following examples: (1) hover, (2) click, and (3) try.
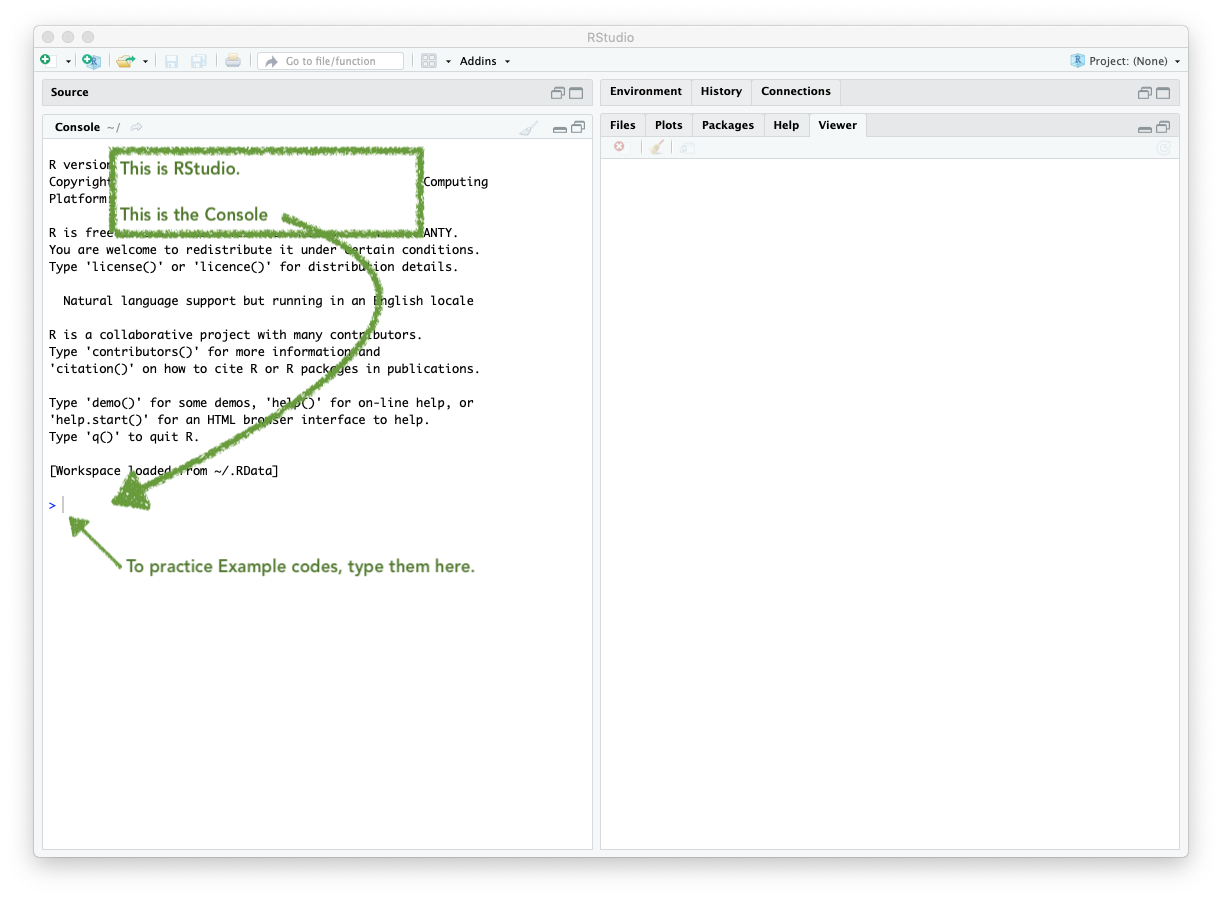
Before you begin working on these Example Codes, ensure you have RStudio open. It should look like this:
Example 1
Remember, “Hover” the code first, then click, then try.
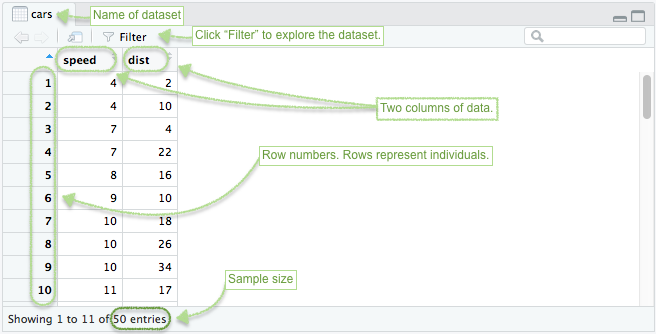
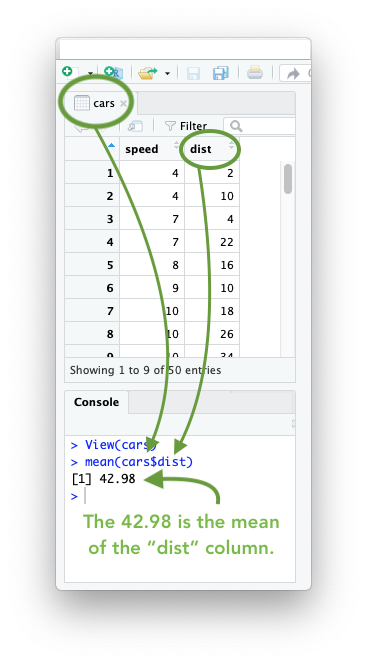
View( The “View” R
function (with a CAPTIAL ‘V’ in View) allows us to view a data set. When
run, this function will open up a new tab in RStudio showing the data
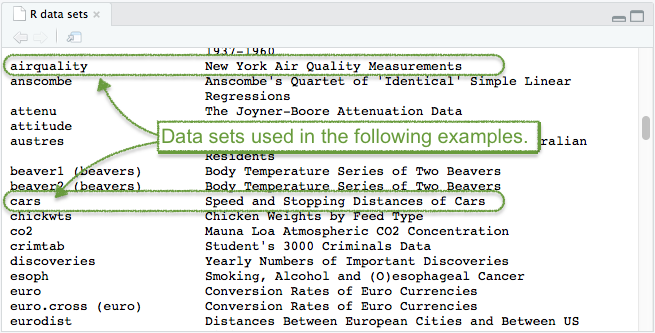
set. cars cars is a data set that is in R. R has
datasets that are available for anyone to use. You can see them using
the data() command. It would be good to explore
View() for a few different datasets. ) Always be sure to end
your function with closing parantheses.
Press Enter to run the code.
Click to Show Tutorial Click to see a full
tutorial on the “View()” command.
Example 2
mean( An R
function “mean()” that will compute the mean of a quantitative column of
data from a data set. cars cars is the name of a data set in R.
Any data set can be used instead by simply typing the name of that data
set instead of cars.
$ The $ sign is a powerful
operator in R. The $ sign allows you to access, or
“purchase,” any column from a data set. Try typing cars$
into R and notice how a selection menu appears with options
dist and speed. dist dist is
one of the two columns from the cars data set. By typing
cars$dist we are essentially pulling that column of data
out of the data set, and then computing the mean of that column with
mean(cars$dist). )
Closing parenthesis for the
mean() function.
Press Enter to run the code.
Click to Show Output Click to see
output.
Example 3
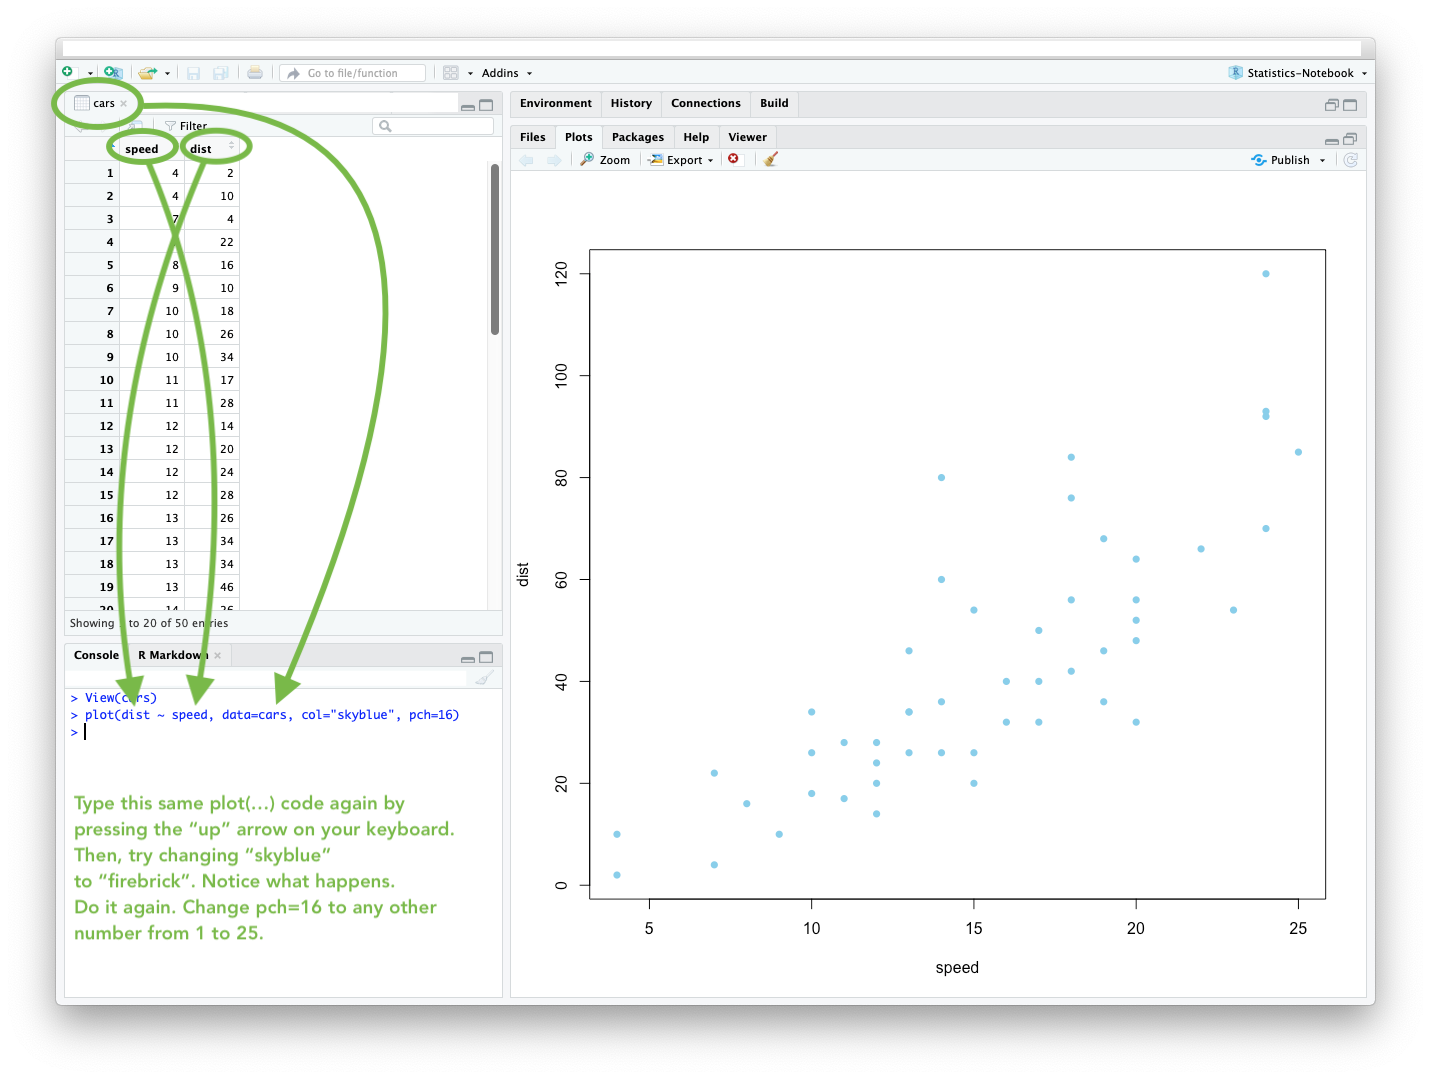
plot( The
plot(...) function allows us to create a plot (usually a
scatterplot) in R. dist dist is the name of a column from the
cars data set. This is going to be the Y-variable of the
plot. The Y-variable always comes first in the plot(Y ~ X)
command. ~ ~ is found on the upper-left key of
your keyboard. It is called the “tilde” or “tilda” symbol. It is used to
state a relationship between Y and X: Y ~ X.
speed
speed is the name of a column. This is going to be the
X-variable of the plot. The X-variable always comes after the
~ in the plot(Y ~ X) command.
, The comma
, is used to separate each entry within a command.
data=cars The
data= statement is used to tell R which data set the
columns of “dist” and “speed” come from. In this case, the
cars data set. ,
The comma , is used to separate
each entry within a command.
col=“skyblue” The col=
statement is used to tell R which color to use in the plot. Type
colors() in your R Console to see what options there are.
This code is using the "skyblue" color. Color names are
always placed in quotes " ". , The comma
, is used to separate each entry within a command.
pch=16 The
pch= statement is used to tell R which plotting character
to use in the plot. Type ?pch in your R Console to see what
options there are. (You’ll need to scroll down in the help file that
appears until you get to the 'pch values' section.
) Closing
parenthesis for the plot(…) function.
Press Enter to run the code.
Click to Show Output Click to View
Output.
This is “the end” of the Getting Started tutorial. To find the “completion code” you will need to study, and “click open” each of the example codes above.