R Markdown Hints
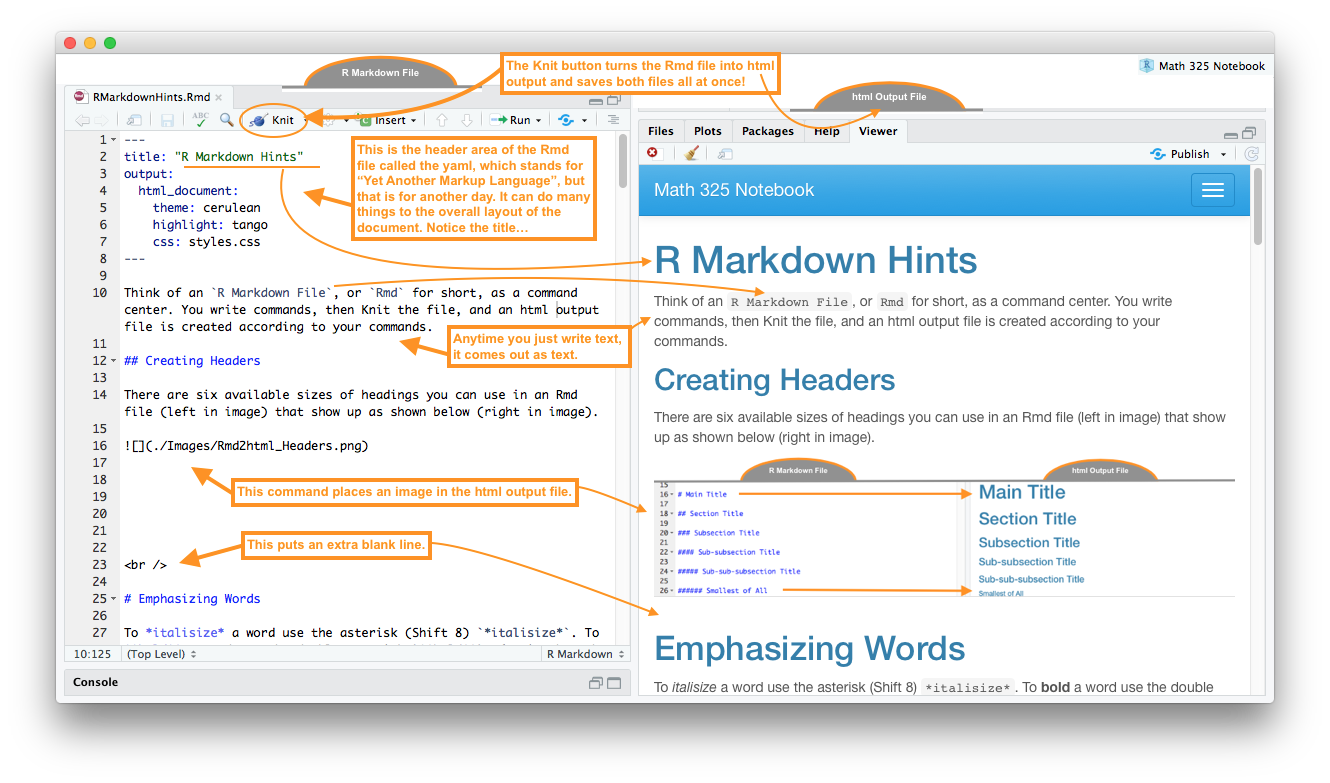
Think of an R Markdown File, or Rmd for
short, as a command center. You write commands, then Knit the file, and
an html output file is created according to your commands.
Overview
Carefully read through all parts of this image to learn…

Click here to see how
These tabs (blue bottons) were created with the code:
## {.tabset .tabset-pills .tabset-fade}

### Label for first button

...stuff you want displayed goes here...

### Label for second button

...stuff to display when button is clicked goes here...

### Make as many buttons as you want

...and put as much content as you want, then end the buttons
with:

##
Creating Links
To make a link use the code
[Name of Link](addressForLink).
Linking to parts of your textbook:
[Numerical Summaries](NumericalSummaries.html)becomes Numerical Summaries[Boxplots](GraphicalSummaries.html#boxplots)becomes Boxplots[R Commands](RCommands.html)becomes R Commands
Linking to outside resources:
[R Colors](http://www.stat.columbia.edu/~tzheng/files/Rcolor.pdf)becomes R Colors
Creating Headers
There are six available sizes of headings you can use in an Rmd file (left in image) that show up as shown below (right in image).

Emphasizing Words
To italicize a word use the asterisk (Shift 8)
*italicize*. To bold a word use the double
asterisk **bold**. The back tic
can be used tohighlightwords by placing back tics on each side of a word:
highlight `.
Bullet Points
Simple Lists
To achieve the result:
This is the first item.
This is the second.
This is the third.
Use the code:
Numbered Lists
To achieve the result:
This is the first item.
This is the second.
This is the third.
Use the code:
Lettered Lists
To achieve the result:
This is the first item.
This is the second.
This is the third.
Use the code:
Math Equations
Use the dollar signs $x=5$ to write \(x=5\) or
$z=\frac{x-\mu}{\sigma}$ to write \(z=\frac{x-\mu}{\sigma}\). For a nicely
centered equation use the double dollar signs $$ $$ on
separate lines
$$
  z = \frac{\bar{x}-\mu}{\frac{\sigma}{\sqrt{n}}}
$$
to get \[ z = \frac{\bar{x}-\mu}{\frac{\sigma}{\sqrt{n}}} \]
Or
$$
  H_0: \mu_\text{Group 1} = \mu_\text{Group 2}
$$
$$
  H_a: \mu_\text{Group 1} \neq \mu_\text{Group 2}
$$
to get \[ H_0: \mu_{\text{Group 1}} = \mu_{\text{Group 2}} \] \[ H_a: \mu_{\text{Group 1}} \neq \mu_{\text{Group 2}} \]
Symbol list:
| Symbol | LaTeX Math Code |
|---|---|
| \(\alpha\) | $\alpha$ |
| \(\beta\) | $\beta$ |
| \(\sigma\) | $\sigma$ |
| \(\epsilon\) | $\epsilon$ |
| \(\bar{x}\) | $\bar{x}$ |
| \(\hat{Y}\) | $\hat{Y}$ |
| \(=\) | $=$ |
| \(\ne\) | $\ne$ or $\neq$ |
| \(>\) | $>$ |
| \(<\) | $<$ |
| \(\ge\) | $\ge$ |
| \(\le\) | $\le$ |
| \(\{ \}\) | $\{ \}$ |
| \(\text{Type just text}\) | $\text{Type just text}$ |
| \(\overbrace{Y_i}^\text{label}\) | $\overbrace{Y_i}^\text{label}$ |
| \(\underbrace{Y_i}_\text{label}\) | $\underbrace{Y_i}_\text{label}$ |
Here is a list of all supported LaTeX commands.
Insert a Picture
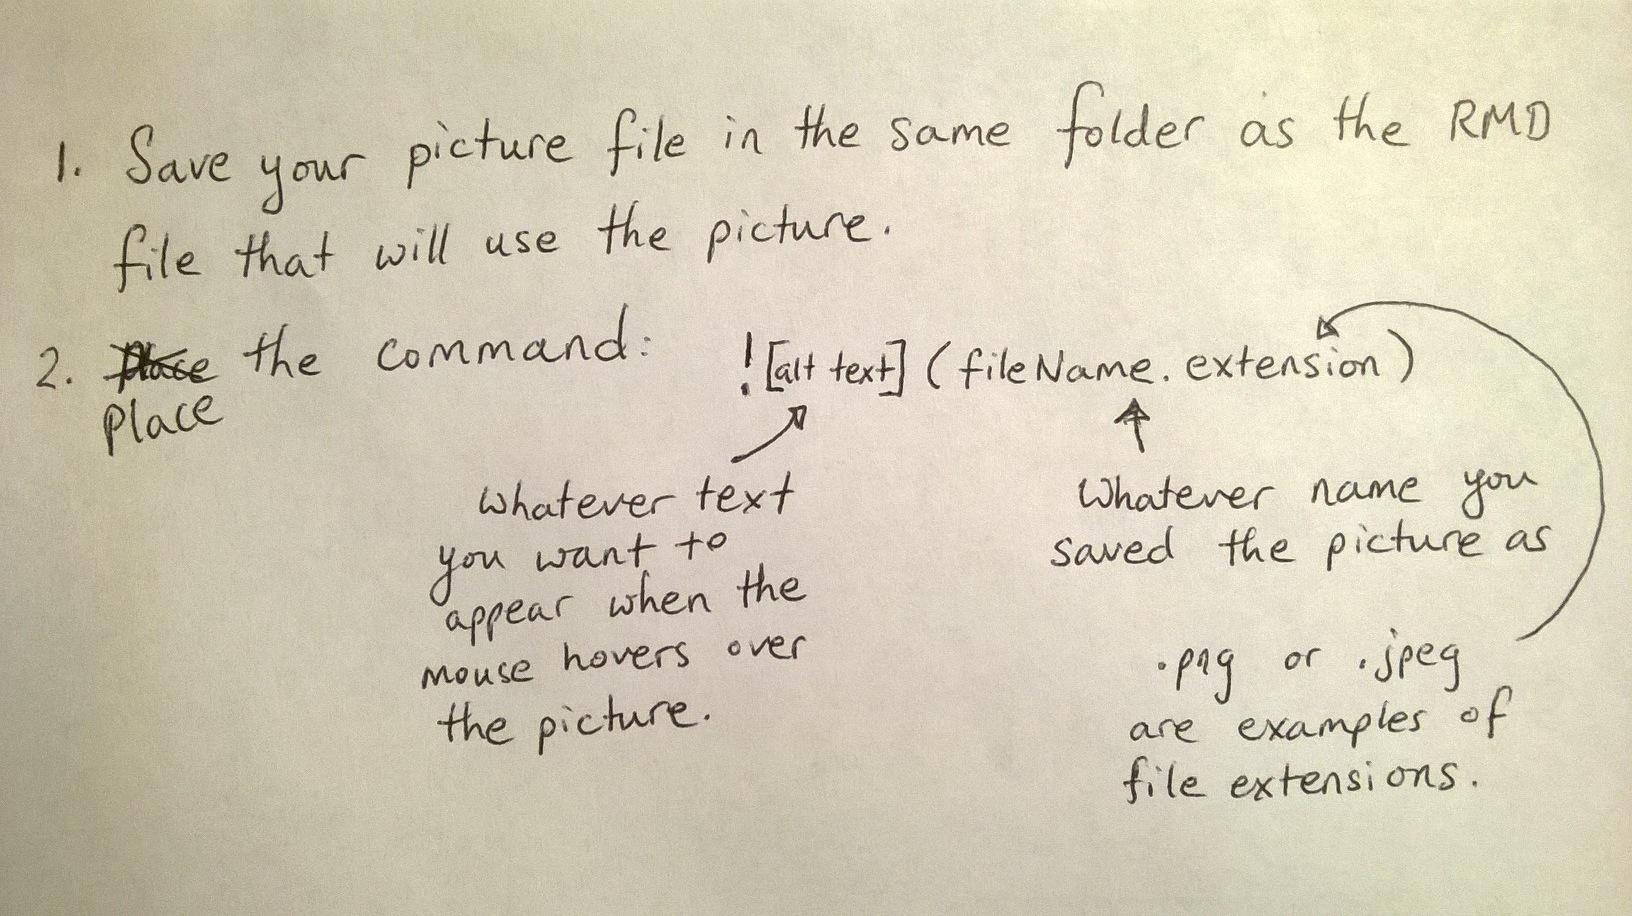
To add a picture to your document, say some notes you took down on paper from class,
Use the code:  to
get…

Tables
There are many ways to make tables in R Markdown. Here is a simple way to make a “pipe” table.
| Name          | Age           | Gender       |
|---------------|---------------|--------------|
| Jill          | 8             |  Female      |
| Jack | 9 | Male || Name | Age | Gender |
|---|---|---|
| Jill | 8 | Female |
| Jack | 9 | Male |
Themes
Notice in the YAML (at the top of the RMD file) there is a line that reads:
“theme: cerulean”
Other possible themes are
- “default”, “cerulean”, “journal”, “flatly”, “readable”, “spacelab”, “united”, and “cosmo”.
You can also change the highlighting by adding the line
“highlight: tango” to the YAML as follows.
Other highlighting options are
- “default”, “tango”, “pygments”, “kate”, “monochrome”, “espresso”, “zenburn”, “haddock”, and “textmate”.
More Information
Go to the rmarkdown.rstudio.com website for more information on how to use R Markdown.
