
Statistics Notebook
This page, and all pages of this notebook, are meant to be customized to become a useful Guide to Statistical Analysis in R for your current and future self.
To begin customizing, download your own copy of the book (if you haven’t already). Please note the GNU General Public License when downloading. You are free to delete this commentary in your own copy of the notebook.
Table of Contents
Hide
Show Notes
Wow! I typed some words. Some blue words, some highlighted words, some big words.
Make a link to a meaningful page of the Statistics-Notebook: Customization Help <- Read through this page!
Or to a page on the internet: R Colors
## [1] 77.88235 Y is a single quantitative variable of
interest. This would be like “heights” of BYU-Idaho students.
Y is a single quantitative variable of
interest. This would be like “heights” of BYU-Idaho students.
One Quantitative Response Variable Y
Graphics
Add your own notes about graphics to use for this type of data here.


Tests
Add your own notes about appropriate inferential procedures for this type of data here.
 Y is a single quantitative variable of
interest. This would be like “heights” of BYU-Idaho students. X is a
qualitative (categorical) variable of interest like “gender” that has
just two groups “A” and “B”. So this logo represents situtations where
we would want to compare heights of male (group A) and female (group B)
students.
Y is a single quantitative variable of
interest. This would be like “heights” of BYU-Idaho students. X is a
qualitative (categorical) variable of interest like “gender” that has
just two groups “A” and “B”. So this logo represents situtations where
we would want to compare heights of male (group A) and female (group B)
students.
Quantitative Y | Categorical X (2 Groups)
Graphics
Add your own notes about graphics to use for this type of data here.


Tests
 Y is a single quantitative variable of
interest, like “heights” of BYU-Idaho students. X is a categorical
(qualitative) variable like which Math 221 you took, 221A, 221B, or
221C. In other words, X has three or more groups. So “Classrank” could
be X, with groups “Freshman”, “Sophomore”, “Junior”, and
“Senior”.
Y is a single quantitative variable of
interest, like “heights” of BYU-Idaho students. X is a categorical
(qualitative) variable like which Math 221 you took, 221A, 221B, or
221C. In other words, X has three or more groups. So “Classrank” could
be X, with groups “Freshman”, “Sophomore”, “Junior”, and
“Senior”.
Quantitative Y | Categorical X (3+ Groups)
Graphics
Add your own notes about graphics to use for this type of data here.


Tests
Add your own notes about appropriate inferential procedures for this type of data here.
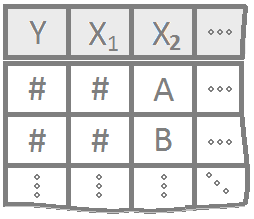
 Y is a single quantitative variable of
interest, like “heights” of BYU-Idaho students. X1 is a categorical
(qualitative) variable like gender, with levels “boy” and “girl.” X2 is
another categorical (qualitative) variable like “Classrank” with levels
“Freshman”, “Sophomore”, and “Junior”. Of course, both X1 and X2 can
have as many levels as you want to work with, but must have at least two
levels each.
Y is a single quantitative variable of
interest, like “heights” of BYU-Idaho students. X1 is a categorical
(qualitative) variable like gender, with levels “boy” and “girl.” X2 is
another categorical (qualitative) variable like “Classrank” with levels
“Freshman”, “Sophomore”, and “Junior”. Of course, both X1 and X2 can
have as many levels as you want to work with, but must have at least two
levels each.
Quantitative Y | Multiple Categorical X
Graphics
Add your own notes about graphics to use for this type of data here.
Tests
Add your own notes about appropriate inferential procedures for this type of data here.
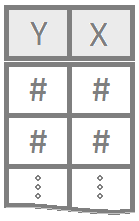 Y is a single quantitative variable of
interest, like “height”. X is another single quantitative variable of
interest, like “shoe-size”. This would imply we are using “shoe-size”
(X) to explain “height” (Y).
Y is a single quantitative variable of
interest, like “height”. X is another single quantitative variable of
interest, like “shoe-size”. This would imply we are using “shoe-size”
(X) to explain “height” (Y).
Quantitative Y | Quantitative X
Graphics
Add your own notes about graphics to use for this type of data here.

Tests
Add your own notes about appropriate inferential procedures for this type of data here.
 Y is a single quantitative variable of
interest, like height. While we could use an X1 of “shoe-size” to
explain height, we might also want to use a second x-variable, X2, like
“gender” to help explain height. Further x-variables could also be
used.
Y is a single quantitative variable of
interest, like height. While we could use an X1 of “shoe-size” to
explain height, we might also want to use a second x-variable, X2, like
“gender” to help explain height. Further x-variables could also be
used.
Quantitative Y | Multiple X
Graphics
Add your own notes about graphics to use for this type of data here.

Tests
Add your own notes about appropriate inferential procedures for this type of data here.
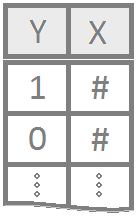 Y is a single categorical (qualitative)
variable of interest where 1 (success) or 0 (failure) are the only
possible values for Y. This would be like “getting an A in Math 325”
where 1 means you got an A and 0 means you didn’t. We might use an
explanatory variable X of “height” to see if taller students are more
likely to get an A in Math 325 than shorter students. (They aren’t, if
you were wondering.)
Y is a single categorical (qualitative)
variable of interest where 1 (success) or 0 (failure) are the only
possible values for Y. This would be like “getting an A in Math 325”
where 1 means you got an A and 0 means you didn’t. We might use an
explanatory variable X of “height” to see if taller students are more
likely to get an A in Math 325 than shorter students. (They aren’t, if
you were wondering.)
Binomial Y | Quantitative X
Graphics
Add your own notes about graphics to use for this type of data here.

Tests
Add your own notes about appropriate inferential procedures for this type of data here.
 Y is a single categorical (qualitative)
variable of interest where 1 (success) or 0 (failure) are the only
possible values for Y. This would be like “getting an A in Math 325”
where 1 means you got an A and 0 means you didn’t. We might use an
explanatory variable X1 of “height” and a second explanatory variable X2
of “gender” to try to predict whether or not a student will get an A in
Math 325.
Y is a single categorical (qualitative)
variable of interest where 1 (success) or 0 (failure) are the only
possible values for Y. This would be like “getting an A in Math 325”
where 1 means you got an A and 0 means you didn’t. We might use an
explanatory variable X1 of “height” and a second explanatory variable X2
of “gender” to try to predict whether or not a student will get an A in
Math 325.
Binomial Y | Multiple X
Graphics
Add your own notes about graphics to use for this type of data here.

Tests
Add your own notes about appropriate inferential procedures for this type of data here.
 Y is a single categorical variable of interest,
like gender. X is another categorical variable of interest, like “hair
color”. This type of data would help us understand if men or women are
more likely to have certain hair colors than the other
gender.
Y is a single categorical variable of interest,
like gender. X is another categorical variable of interest, like “hair
color”. This type of data would help us understand if men or women are
more likely to have certain hair colors than the other
gender.
Categorical Y | Categorical X
Graphics
Add your own notes about graphics to use for this type of data here.

Tests
Add your own notes about appropriate inferential procedures for this type of data here.