R Introduction Case Study (Key)
They make that much…
We need two datasets in R that we can use to try out the functions and answer the questions. If you want my “Rmd” file you can download it here.
data.dir = "http://byuistats.github.io/M330/data"
salary = read.csv(file.path(data.dir,"Top100_CEO.csv"),stringsAsFactors = FALSE)
company = read.csv(file.path(data.dir,"Top100_CEO_company.csv"),stringsAsFactors = FALSE)
Taking a look at the data
In the file you have created use the functions listed in the R Code Tutorial to examine the salary and company data that we have read into R.
Here is how I addressed the questions that are asked below using R.
How many CEOs make less than $25 million dollars?
head(salary)## ticker company ceoname year
## 1 VRX Valeant Pharmaceutical International J. Michael Pearson 2015
## 2 MASI Masimo Corporation Joe Kiani 2015
## 3 SCTY SolarCity Corporation Lyndon R. Rive 2015
## 4 GBL Gamco Investors Mario J. Gabelli 2015
## 5 PANW Palo Alto Networks Mark D. Mclaughlin 2015
## 6 CBS CBS Corporation Leslie Moonves 2015
## compensation
## 1 143077442
## 2 119222614
## 3 77318016
## 4 75018176
## 5 66606716
## 6 56773822nrow(subset(salary,compensation<25000000))## [1] 55What is the spread of the Top 100 CEO compensations (numerical and plot)?
maxmin = with(salary,range(compensation))
diff(maxmin) # this is the spread
## [1] 124146374formatC(diff(maxmin),big.mark=",") # code to add commas. Ignore this if you want.## [1] "124,146,374"hist(salary$compensation)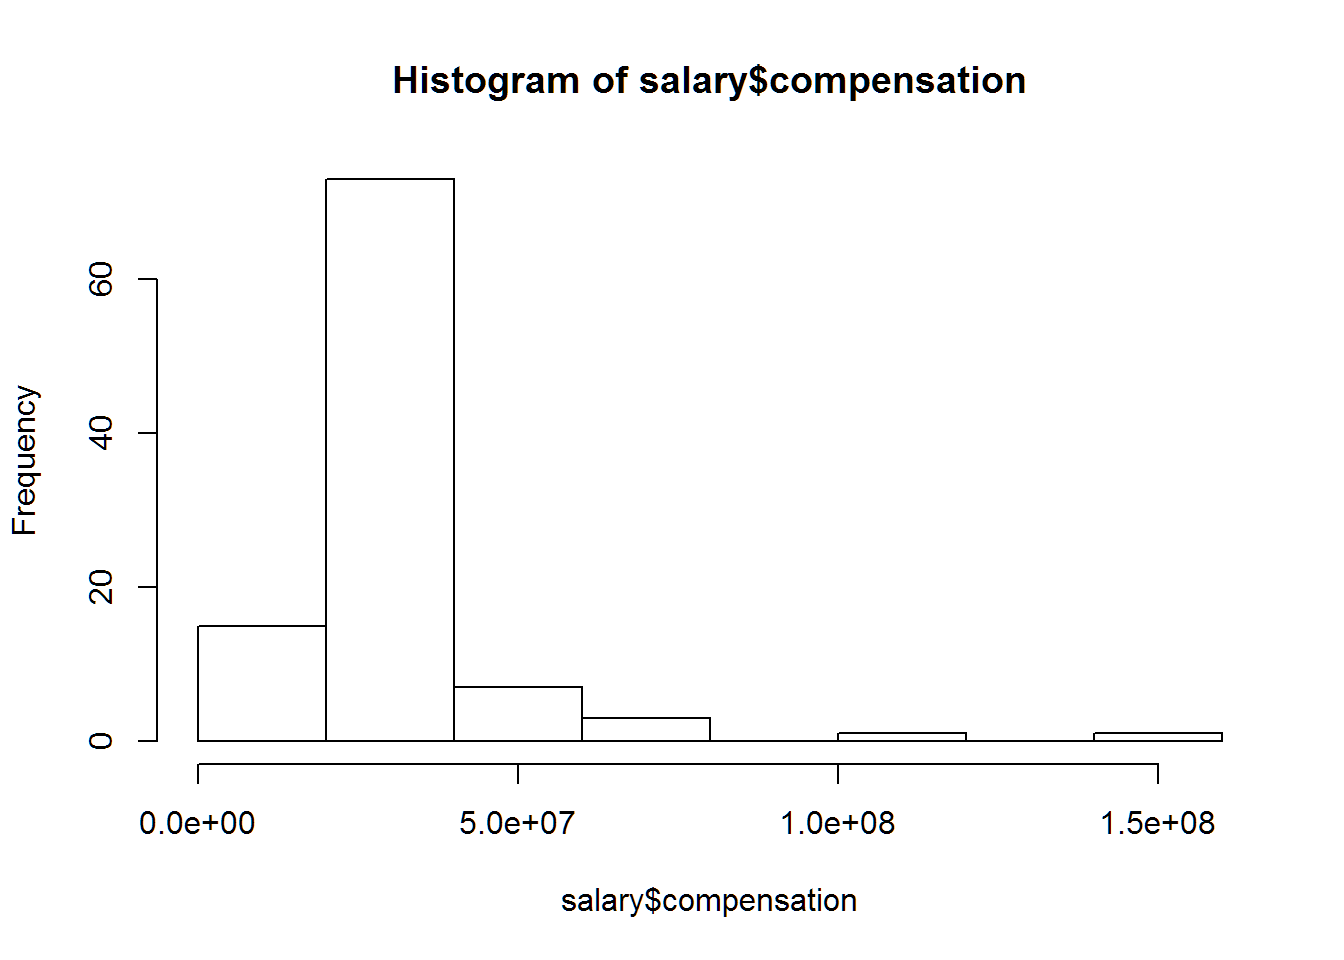
# but I don't like the x-axis lables
hist(salary$compensation/1000000,xlab="Millions ($)")
# could play with the breaks
hist(salary$compensation/1000000,xlab="Millions ($)",breaks=25)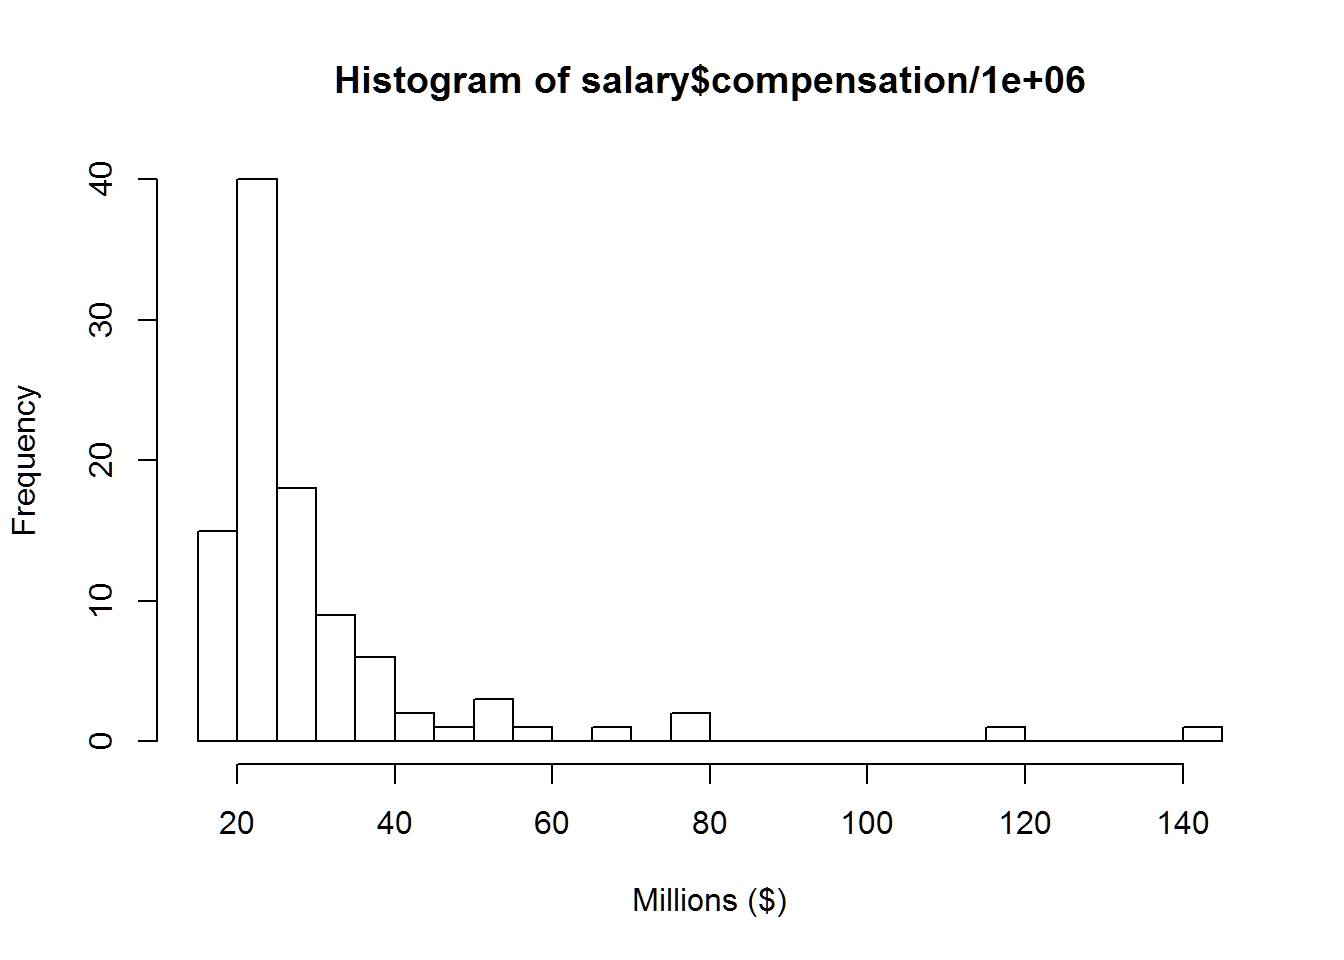
Which company has the smallest value?
head(company)## X ticker price PE_ratio value_bill
## 1 VRX VRX 27.28 NA 9.48
## 2 MASI MASI 59.34 31.12 2.93
## 3 SCTY SCTY 17.50 NA 1.75
## 4 GBL GBL 28.79 9.05 0.84
## 5 PANW PANW 149.10 NA 13.55
## 6 CBS CBS 51.79 15.32 23.03### In R most function defualt to NA if any values in the set are NA. You can change
### This behavior by using na.rm=T
min_value = min(company$value_bill,na.rm=T)
subset(company,value_bill==min_value)## X ticker price PE_ratio value_bill
## 40 HRTG HRTG 13.45 6.48 0.4What is the difference between the mean and median CEO compensation?
ceo_mean = mean(salary$compensation)
ceo_median = median(salary$compensation)
ceo_mean - ceo_median
## [1] 6307702Which company has the largest price to earnings ratio?
###  You can change this behavior by using na.rm=T
max_pe = max(company$PE_ratio,na.rm=T)
subset(company,PE_ratio==max_pe)
## X ticker price PE_ratio value_bill
## 46 ALXN ALXN 131.46 330.3 29.48What is the standard deviation of the earnings ratios?
sd(company$PE_ratio,na.rm=T)## [1] 54.06166