Lesson 21: Describing Bivariate Data; Scatterplots, Correlation, and Covariance
Homework
The provided reading as given you the concepts of regressions, correlation, and a least squares line. The following links provide the R-code examples to complete this assignment.
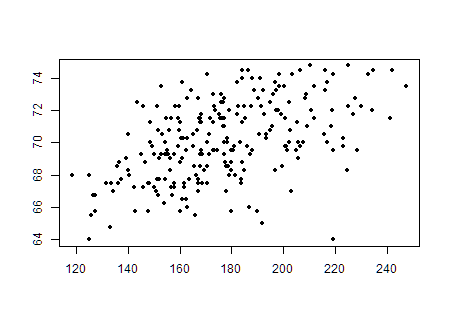
For each of the following scatterplots, describe the data by its form (linear or nonlinear), its direction (positive, negative, or neither), and its strength (weak, moderate, or strong). Answers may vary.
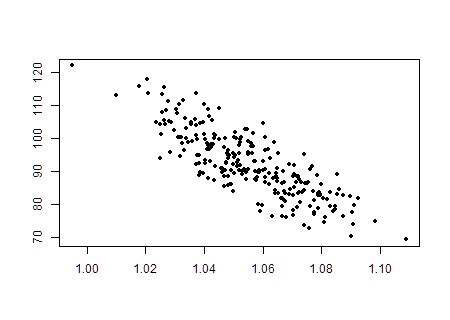
ChartOne
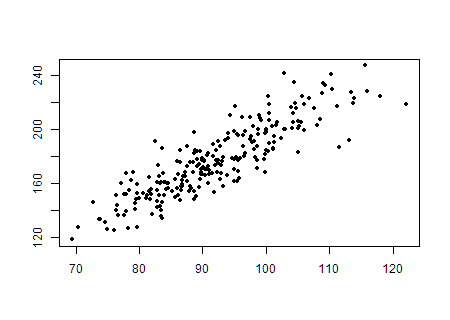
ChartTwo
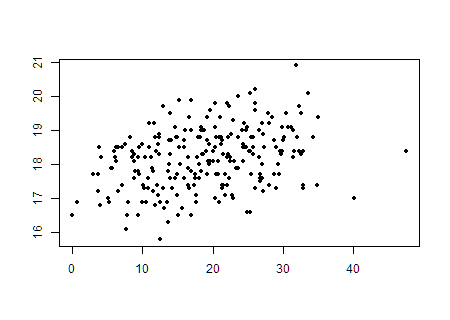
ChartTwo
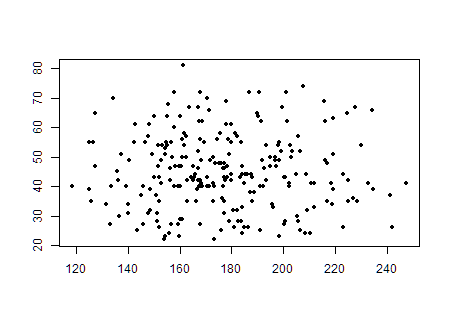
ChartTwo
ChartTwo
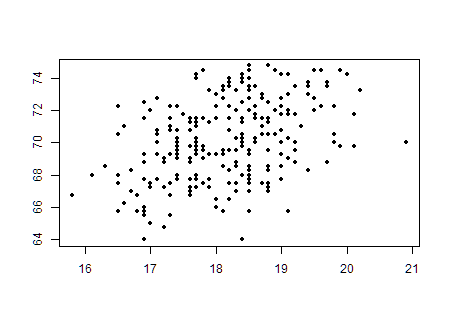
ChartTwo
Which of the following best describes the relationship between two variables, if their correlation coefficient is r = −0.997?
There is a strong positive linear relationship between the variables.
There is a weak negative linear relationship between the variables.
There is a strong negative linear relationship between the variables.
There is virtually no linear relationship between the variables.
This cannot be determined from the information given.
Data was collected on homes for sale in Madison County as of January 2011. Information on the listings such as price, size of the home, and style were recorded. Open the data file MadisonCountyRealEstate. Use this data to answer questions 8 through 12.
Madison = read.csv(file = "https://raw.githubusercontent.com/byuistats/data/master/MadisonCountyRealEstate/MadisonCountyRealEstate.csv", header = TRUE, stringsAsFactors = FALSE)Create and attach a scatterplot of the price of homes (ListPrice) compared with square footage (SQFT).
Describe the data displayed on the scatterplot. Does it appear linear or nonlinear? Does it have a positive or negative association, or neither? Does the association appear weak, moderate, or strong?
Compute the sample correlation coefficient (r).
Compare your description of the scatterplot from question 9 with the value of r that has been computed. Was your description correct or incorrect? What was clarified by seeing the correlation coefficient?
Compute the sample covariance (sxy) of this data.
The website www.cars.com contains listings for automobiles. A sample of Saturn vehicles listed for sale in the Los Angeles area was collected from cars.com and saved as the data file LASaturnWinter06. Among the variables given in the data set are the asking price (Price) and the number of miles shown on the odometer (Mileage) of each car. Use this data to answer questions 13 through 17.
Saturn = read.csv(file = "https://raw.githubusercontent.com/byuistats/data/master/LASaturnWinter06/LASaturnWinter06.csv",header = TRUE,stringsAsFactors = FALSE)Create and attach a scatterplot of the Price compared with Mileage.
Describe the data displayed on the scatterplot. Does it appear linear or nonlinear? Does it have a positive or negative association, or neither? Does the association appear weak, moderate, or strong?
Compute the sample correlation coefficient (r).
Compare your description of the scatterplot from question 14 with the value of r that has been computed. Was your description correct or incorrect? What was clarified by seeing the correlation coefficient?
Compute the sample covariance (sxy) of this data.