Project 1: What’s in a Name?
Walkthrough
Background
We will complete six projects during the semester that each take about two weeks (four days of class). On average, a student will spend 2 hours outside of class per hour in class to complete the assigned readings, submit any Canvas items, and complete the project (for a total of 8 hours per project). The instruction for each project will be structured into sections as written on this page.
This first Background section provides context for the project. Make sure you read the background carefully to see the big picture needs and purpose of the project.
Early in prehistory, some descriptive names began to be used again and again until they formed a name pool for a particular culture. Parents would choose names from the pool of existing names rather than invent new ones for their children.
With the rise of Christianity, certain trends in naming practices manifested. Christians were encouraged to name their children after saints and martyrs of the church. These early Christian names can be found in many cultures today, in various forms. These were spread by early missionaries throughout the Mediterranean basin and Europe.
By the Middle Ages, the Christian influence on naming practices was pervasive. Each culture had its pool of names, which were a combination of native names and early Christian names that had been in the language long enough to be considered native. [ref]
Client Request
This csv file contains the number of times a name was given to a child in a specific year. The Client has a passion for names throughout history. They would like to know how the usage of names has changed over time. They are particularly interested in the names Mary, Martha, Peter, and Paul. They would also like to know how the usage of a name from a famous movie has changed over time.
Data
Every data science project should start with data, and our class projects are no different. Each project will have ‘URL’ and ‘Information’ links like the ones below. Right click the ‘URL’ link and select “Copy Link” to use it to import the data into your project. This is the preferred method to get data into your report as you will be publishing your report to GitHub. If you choose to download the data file to your computer you will need to save it in the same folder as your project#.qmd file for it to work correclty in GitHub.
URL: names_year.csv
Information: data.md
Readings
The Readings section will contain links to reading assignments that are required for each project, as well as optional references. Remember that you are reading this material to build skills. Take the time to comprehend the readings and the skills contained within.
We recommend reading through the assigned material once for a general understanding before the first day of each project. You will reread and reference the material multiple times as you complete the project.
- Pandas Tutorial 1: What kind of data does pandas handle?
- Pandas Tutorial 2: How to read and write tabular data?
- Pandas Tutorial 3: How to select a subset of a DataFrame?
- P4DS Ch4.3.2 Filtering Rows with Query
- P4DS Ch14.2-14.3 Labels, titles, contextual info, Annotations
- P4DS Ch11 Visualization
- P4DS Ch12.1-12.3
Optional References
Questions and Tasks (Core)
This section lists the questions and tasks that need to be completed for the project. Your work on the project must be compiled into a report, rendered to a HTML file and uploaded in Canvas.
There are two types of questions: Core and Stretch. Core questions are required for each project. The course syllabus competencies requires specic a number of projects having all the Stretch questions achived based on your goals for the grade level you are seeking.
Download this Project1 Template template. The answer to each question should include a chart and a written response. The years labels on your charts should not include a comma. At least two of your charts must include reference marks.
- How does your name at your birth year compare to its use historically?
- If you talked to someone named Brittany on the phone, what is your guess of his or her age? What ages would you not guess?
- Mary, Martha, Peter, and Paul are all Christian names. From 1920 - 2000, compare the name usage of each of the four names in a single chart. What trends do you notice?
- Think of a unique name from a famous movie. Plot the usage of that name and see how changes line up with the movie release. Does it look like the movie had an effect on usage?
Questions and Tasks (Stretch)
Here is an example Stretch question(s) for this project. Your instructor may assign different Stretch question(s). You must comment in Canvas when submitting your project if you completed any of the Stretch questions.
Reproduce the chart Elliot using the data from the
names_year.csvfile.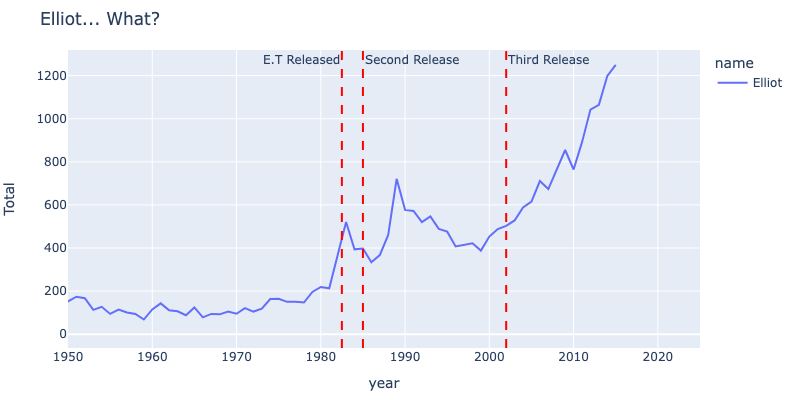
Submission:
When you have completed the report, you will need to follow this process to submit your work:
- Have the
P1_templateopen in VS Code and nothing else - Click
Preview Buttonin VS Code in the top right of the screen- This will render the project but also entire course work portfolio into
HTMLfiles for review - Confirm everything displas as you would like it to
- How you see it will be how it is viewed for grading
- If there is an error in any cell of the quarto files, the rendering will stop and you will need to fix the error before rendering again (if you get stuck post your error in Slack)
- This will render the project but also entire course work portfolio into
- Once the report is confirmed close the preview and open a VS Code
Terminal- click
Terminalin the top menu bar and thenNew Terminal
- click
- Type the following in the terminal
quarto render- Then drag and drop
P1_template.qmdinto the terminal this will add the file path to the terminal command - Press Enter
- Then drag and drop
- This will render the project into a
HTMLfile in the same location as the.qmdfile - To locate the file in VS Code
- Right click on the file in the file explorer and select
Reveal in File Explorer(Win) orReveal in Finder(Mac)
- Right click on the file in the file explorer and select
- Upload
HTMLfile into Canvas
Deliverables:
Deliverables are “the quantifiable goods or services that must be provided upon the completion of a project”. In this class the deliverable for each project is a GitHub published report created using Quarto files. This final section will be the same for each project.
Use this P1_template to submit your Client Report.
- Answers to the questions | tasks. Each should include a written description of your results, code cells with comments, charts and/or tables.
- A short summary of work must be submitted in the comments in Canvas wwhen you submit the URL. Rate your own work on a scale of 1-5. 1 being poor and 5 being excellent. Include a short description of why you rated your work the way you did.
Your report should be written in quarto markdown files and rendered to an HTML File. Upload the HTML file in Canvas. (Do not submit the .qmd file)
Feedback:
If you submit before the due date, you will recieve feedback and/or coaching notes. You will need to address the feedback, re-render and resubmit the project.
Resubmission:
If you submit before the due date, you will have one opportunity to resubmit the project after you have received feedback. The window for the resubmission will be open through the Wednesday following the due date of the project.