Case Study
- Measuring LEGO case study questions?
- Working with a partner but presenting and submitting individually.
- You work together to get data recording done, but each of you creates your own visualizations and presentation.
- You can use similar images, but your presentation and Tableau file should be your own creation.
- Case study quizes.
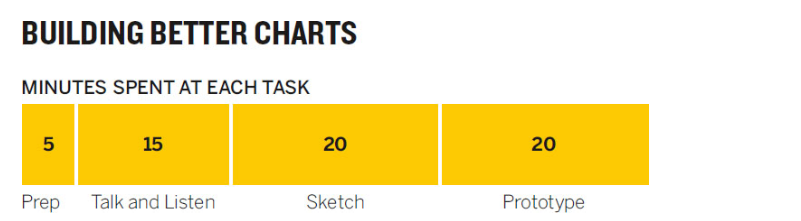
Chapter 4: Better Charts in a couple of hours (73-86)
![]()
- Prep: Visualization is creative communication. It takes time, so block it out in 1-2 hour chunks.
- Talk & Listen: Find people that will listen and then talk their ear off. But listen to what they don’t understand.
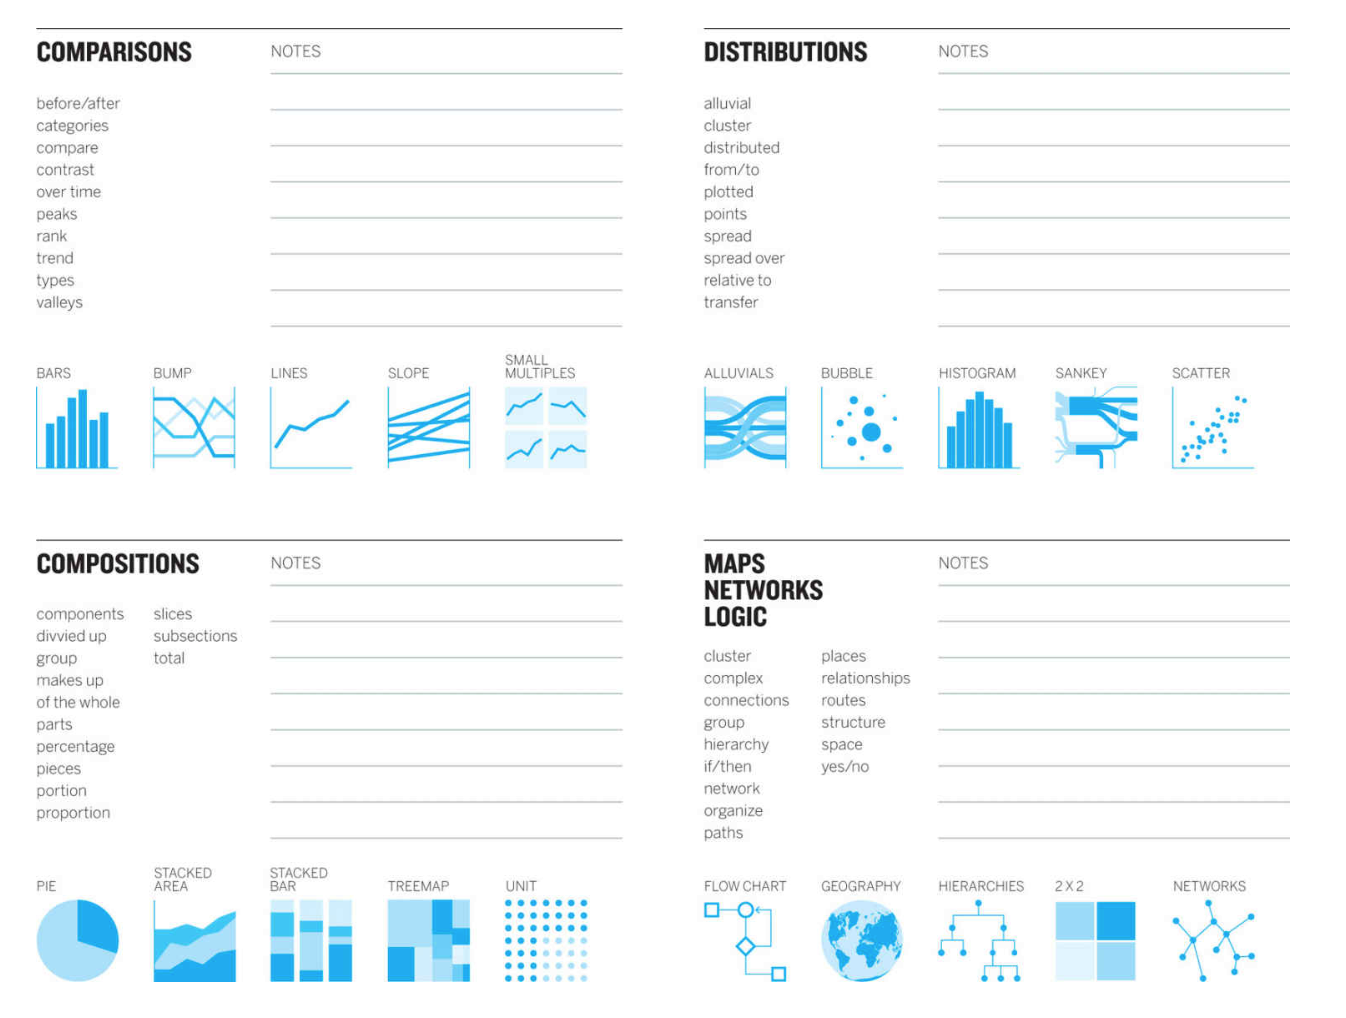
- Sketch: This is hard. Don’t be afraid to make mistakes. Use a visualization topic guide or use good chart cheatsheet.
- Prototype: Next class discussion
Talk, Sketch, Listen, Prototype…
After prep, all of these can happen at the same time when you are working in a group. As long as everyone has come prepared. Hejazi and Voisin climate paper example.
If you were a Walmart buyer of cherry tomatoes, what specifications would you give them to make sure you got the size you wanted in the store?
- How might a supplier user your metric to their advantage?
- How could the metric provide safety for Walmart and the supplier?