Swimming in data
xkcd for the day

Good Reads
Chapter 3: Two questions to four types
Conceptual Visualizations
Supplemental Reading
Measures of Center Discussion
Measures of Center Activity
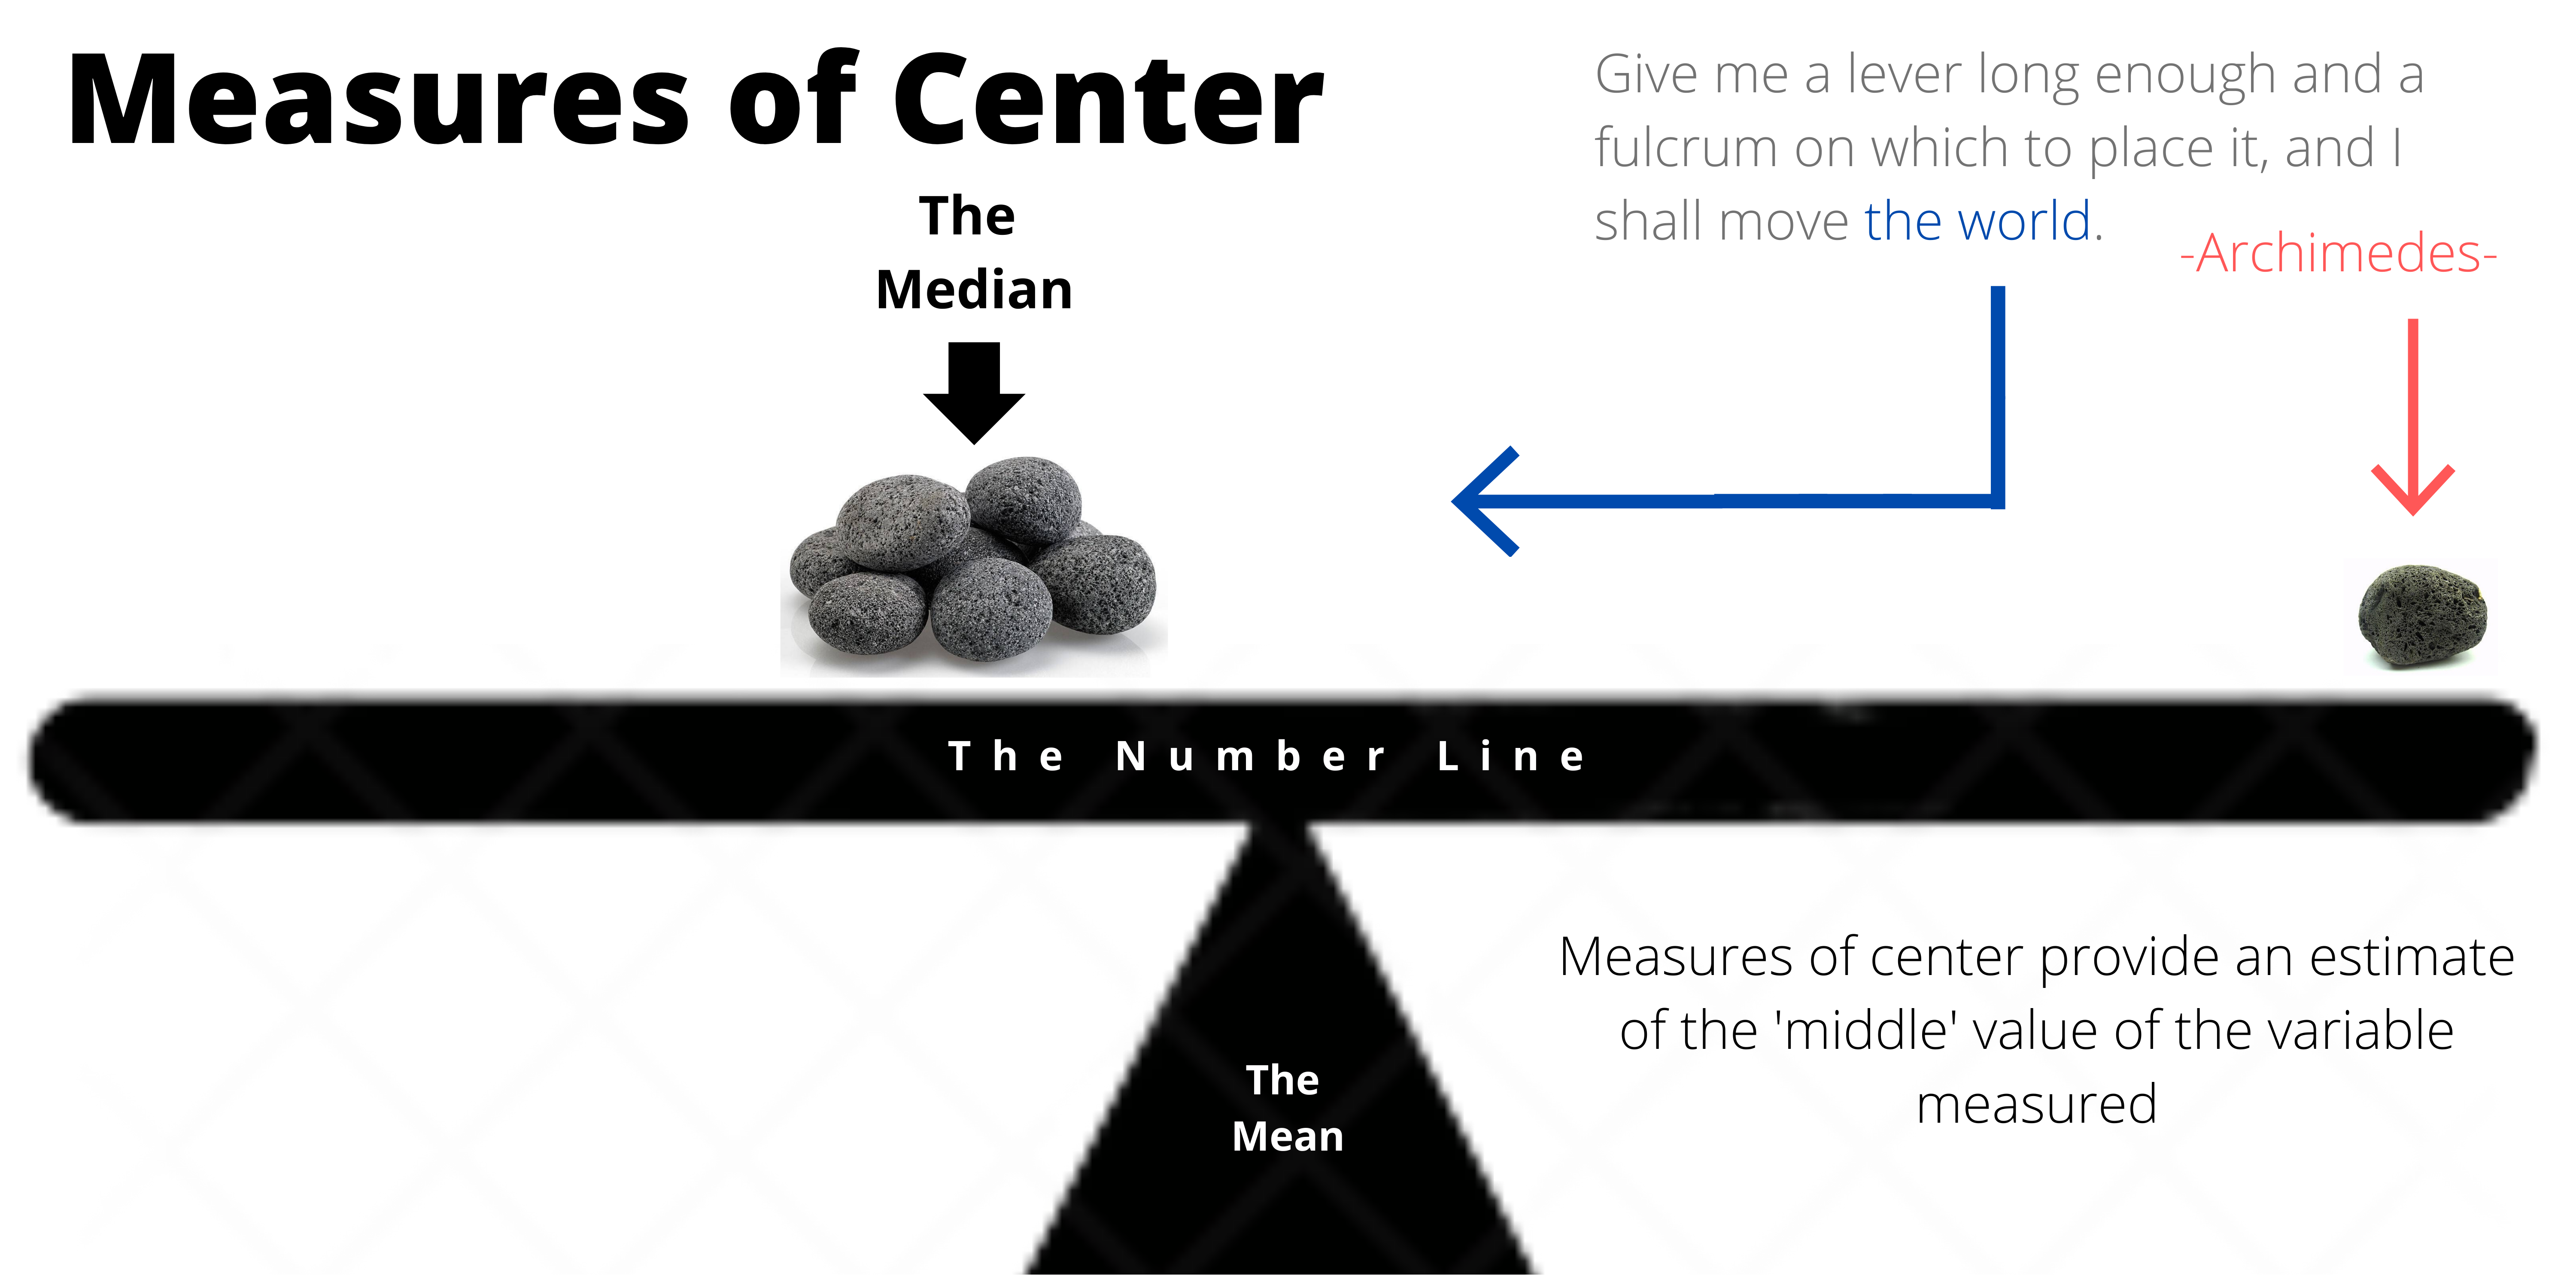
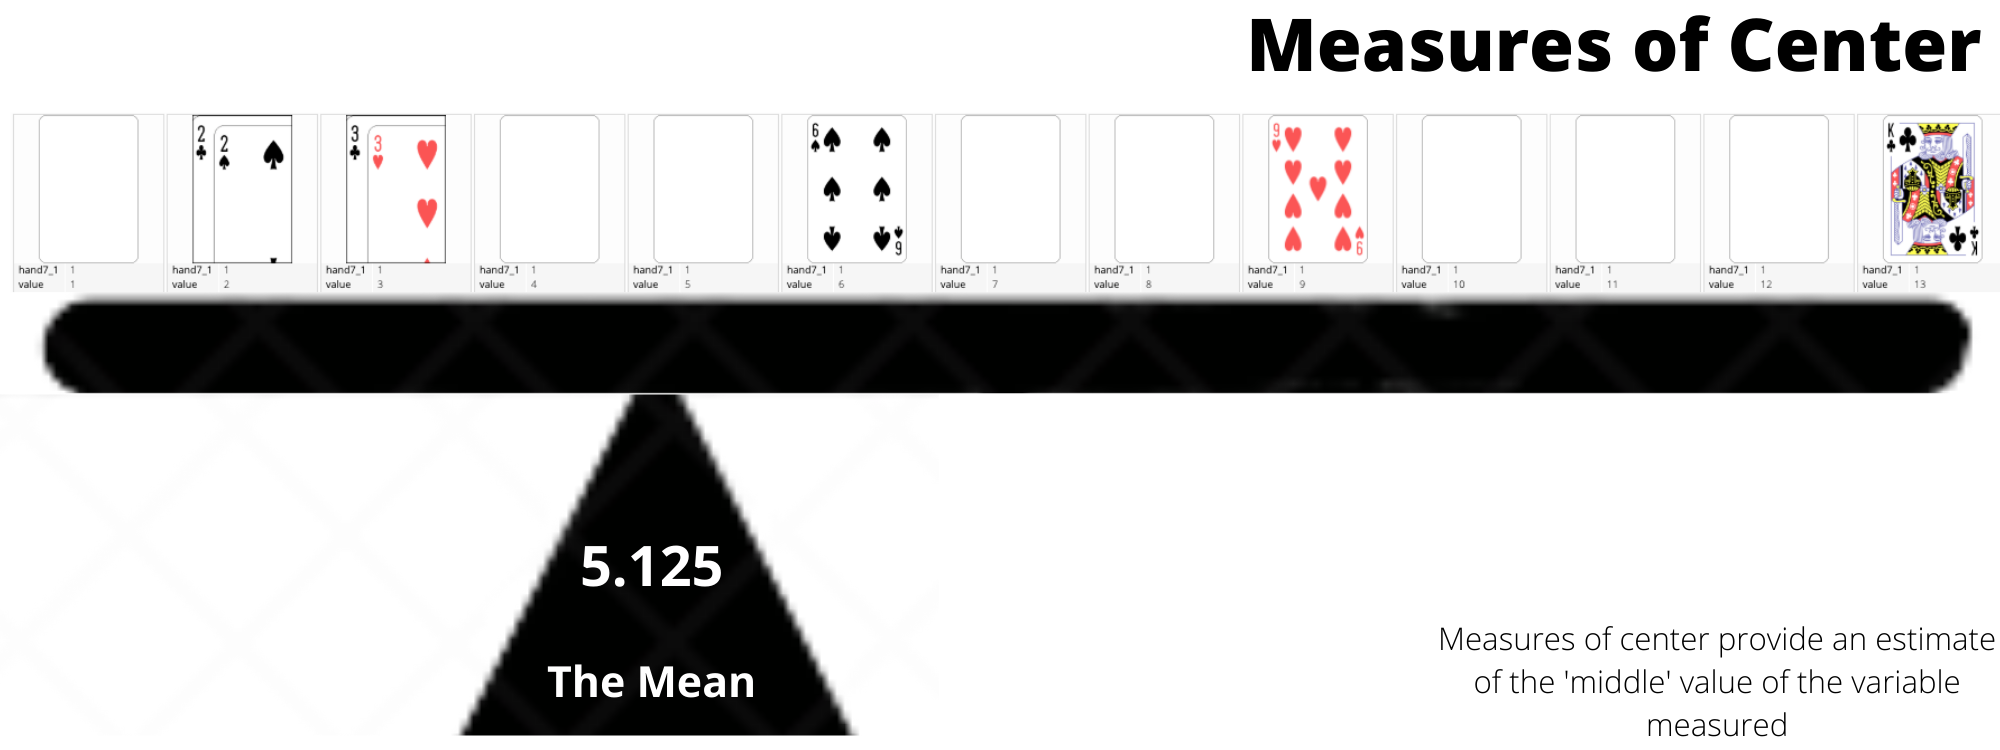
Measures of Center
Break into groups and decide an answer to the following question
- What does the phrase ‘measures of center’ mean?
- What do you notice about the mean’s location relative to the median?
- Why do we use measures of center?
- Which measure of center do you prefer?
- Which measure would represent a typical net worth of people living in Seattle better?
- Bill Gates walks into a bar
Questions on Measures of Center
Tools: Tableau
Two tools: Both should work
First Try
We have curated a list of tools readings and videos. I would not skip the material we have picked.
- Connecting to Google Sheets
- Registered Training (pill types): Their videos are great and should be used.
Working with Tableau
Tackle the following questions
- Create a bar chart of the top 20 merchants by sales. Which are the top 2 merchants by sales?
Case Study
- Measuring LEGO case study questions?
- Working with a partner but presenting and submitting individually.
- You work together to get data recording done, but each of you creates your own visualizations and presentation.
- You can use similar images, but your presentation and Tableau file should be your own creation.
- You work together to get data recording done, but each of you creates your own visualizations and presentation.