Math 335
Syllabus
Tools
R/R-Studio Details
Slack & Stackoverflow Details
R-Lab
RStudio Connect
Python Details
Tasks
Hathaway
Assignment Schedule
Weekly Reading List
Palmer
Assignment Schedule
Weekly Reading List
General
Semester Task List
Team Lead Guidance
Task Backgrounds
Project
R-Lab
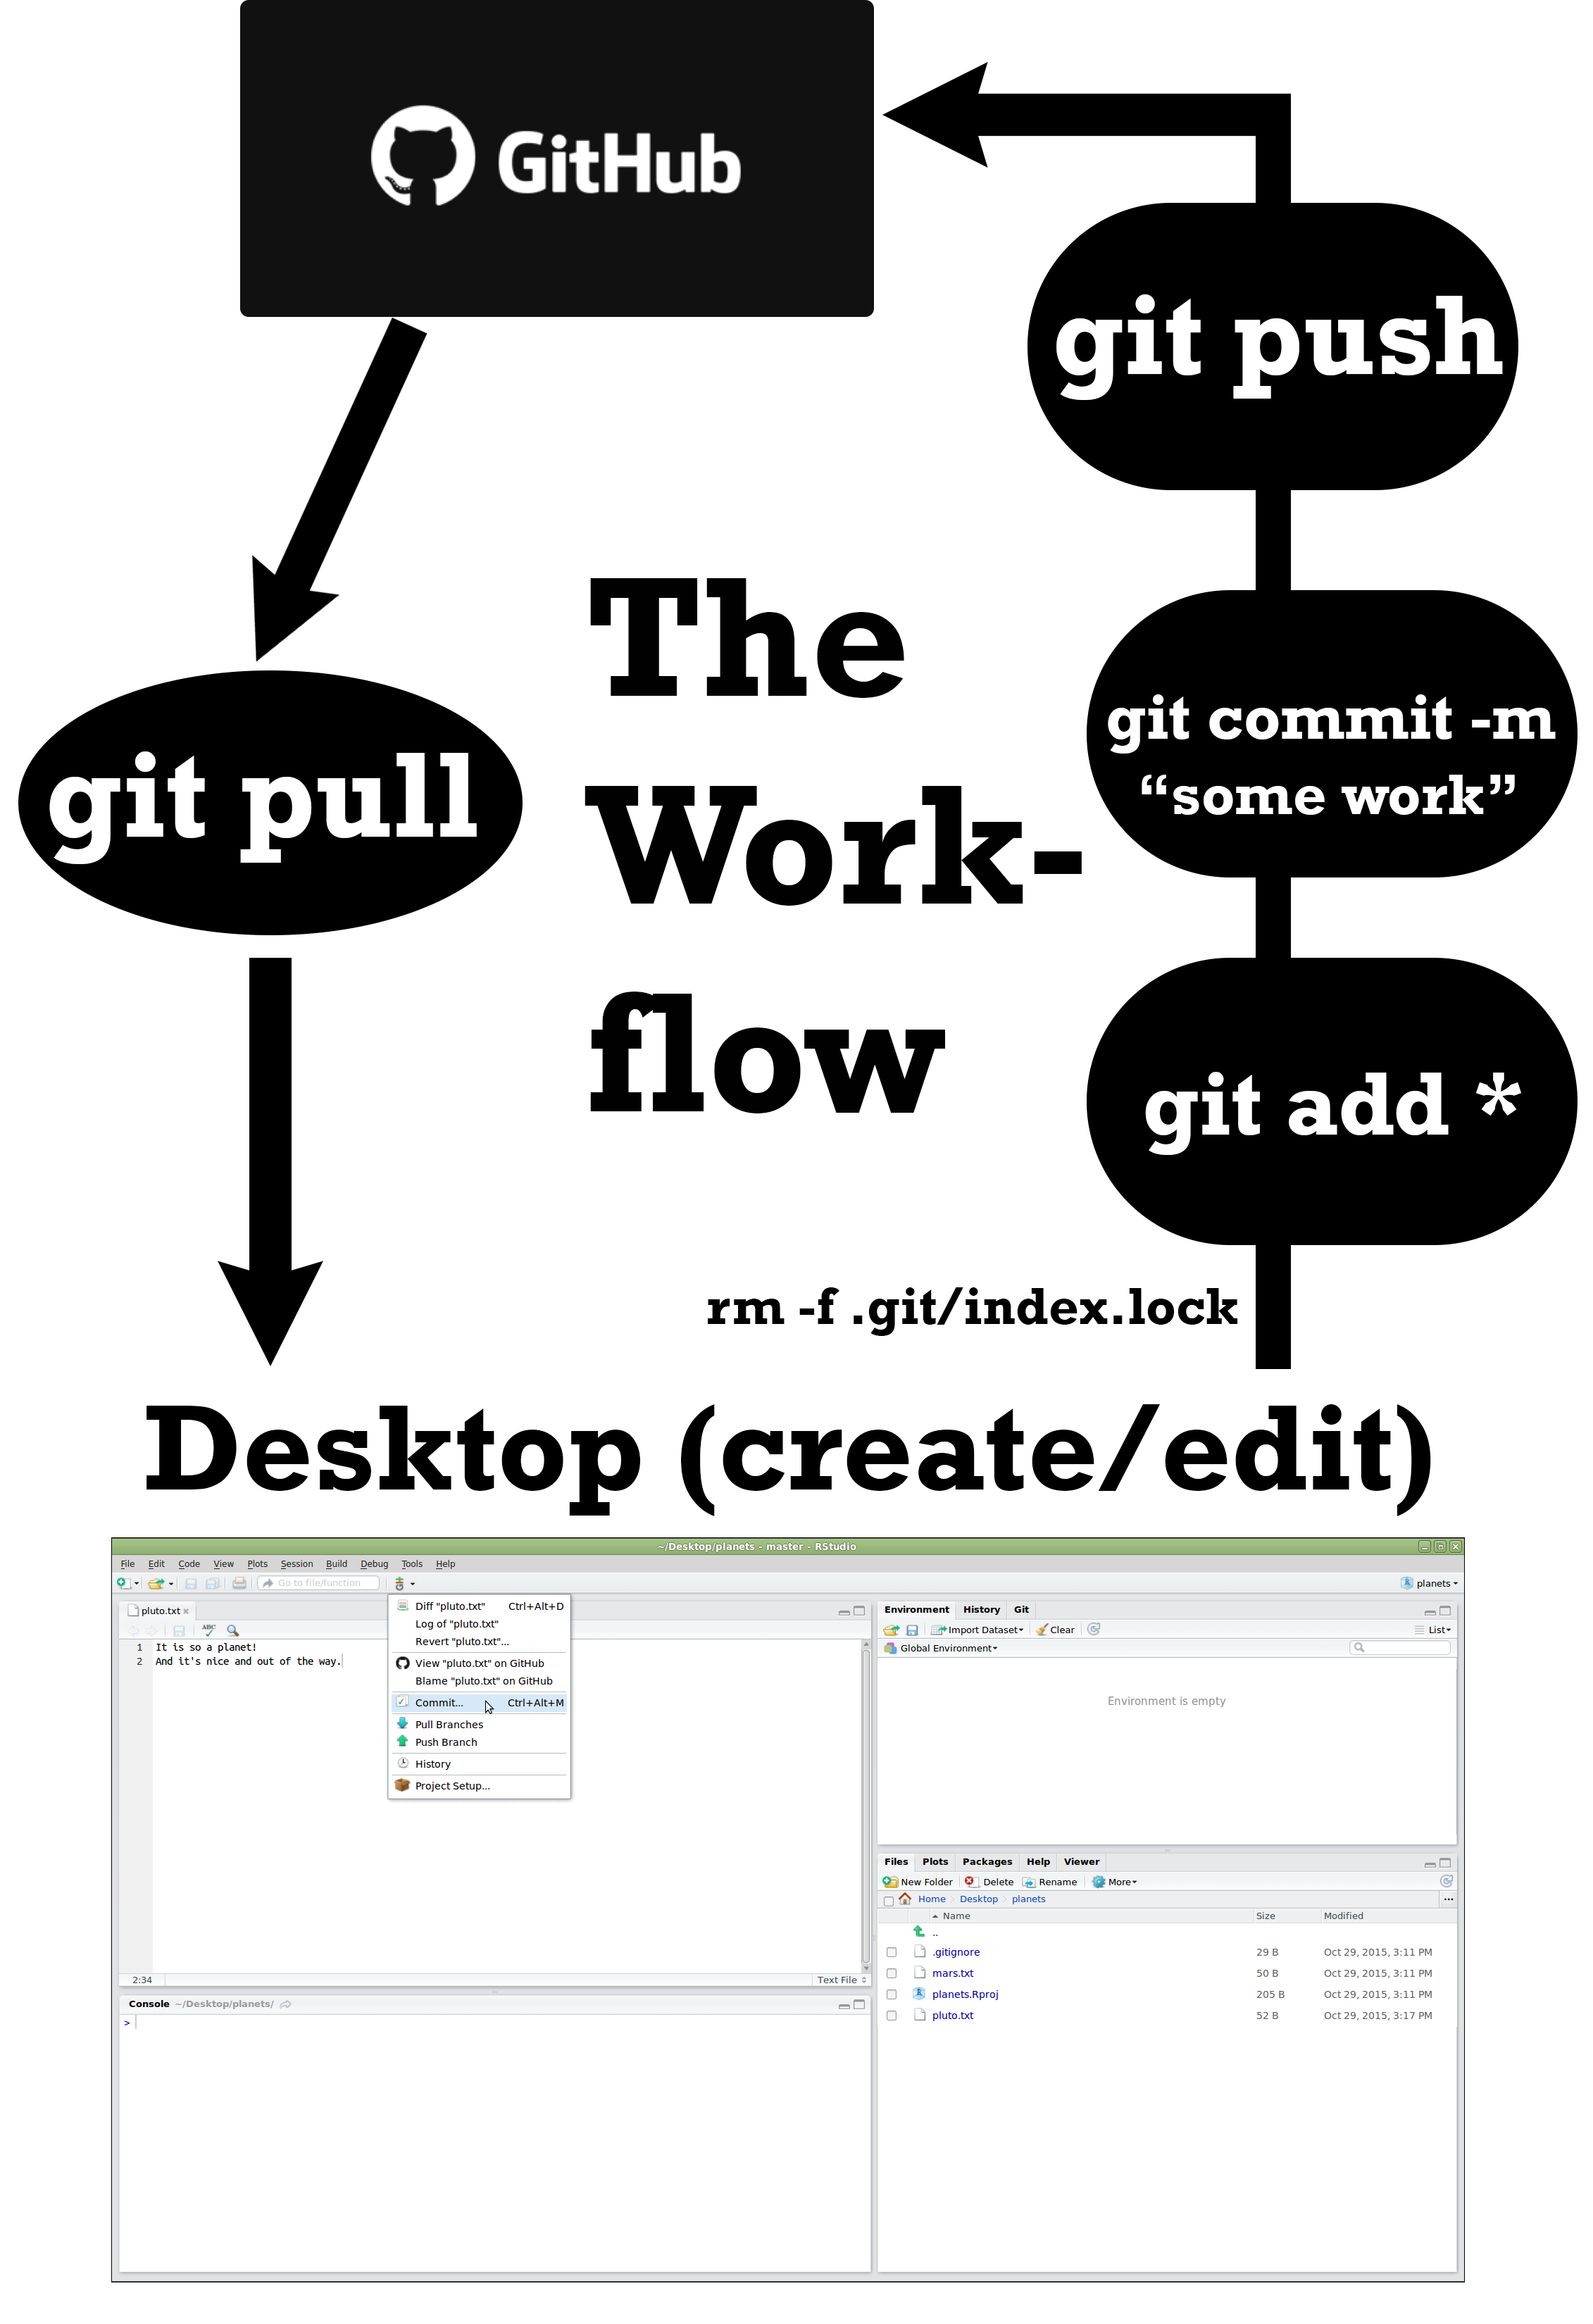
Git/GitHub
Start Here
One Image
Additional Links
Book
Course Textbook
R for Data Science
Git/GitHub and R
R Markdown: The Definitive Guide
Geocomputation with R
Supplemental Material
Happy Git and Github for the useR
plotly for R
Computing in R for Social Sciences
Statistical Concepts in Presenting Data:
Advanced R
R Packages
Tidy evaluation
Fundamentals of Data Visualization
Geocomputation with R
Crosstalk: htmlwidgets add-on
Visit Me
R Visualization
slick table to navigate GGplot2 commands
GGplot port to Python
Python Bokeh port to R
Plotly for R
Other Great Visualizations
Fathom: Nike+
Fathom: New York Poverty
Virus Trading Cards
Interactive World Shipping Map 2012
The Origin of Species
Wind Movement Map