Exploratory Data Analysis
J. Hathaway
Becoming the Critic.
Great Quotes
‘There are no routine statistical questions, only questionable statistical routines.’
— Sir David Cox
‘Far better an approximate answer to the right question, which is often vague, than an exact answer to the wrong question, which can always be made precise.’
— John Tukey
Review
Case Study 4: Reducing Gun Deaths (FiveThirtyEight)
Take 10 minutes to brainstorm with your table what the data inputs are and what visualizations you would like to create?
- What mutations or summaries will you need to do?
- What difficulties do you expect?
- Do each of the task items make sense?
Task 8: World Data Investigations - Part 2
Socrative Hours Quiz
Your research questions
- Share your research question with your neighbor and explain why finding an answer to the question with data would be exciting.
- Then we can discuss a few as a class.
What is EDA?
Socrative Quiz
Exploratory Data Analysis
EDA is fundamentally a creative process. And like most creative processes, the key to asking quality questions is to generate a large quantity of questions.
- What type of variation occurs within my variables?
- What type of covariation occurs between my variables?
Understanding case_when()
case_when() is particularly useful inside mutate when you want to create a new variable that relies on a complex combination of existing variables. Write a short sentence that says what this code is doing?
starwars %>%
  select(name:mass, gender, species) %>%
  mutate(
    type = case_when(
      height > 200 | mass > 200 ~ "large",
      species == "Droid"        ~ "robot",
      TRUE                      ~  "other"
    )
  )

#> # A tibble: 87 x 6
#>                  name height  mass gender species  type
#>                 <chr>  <int> <dbl>  <chr>   <chr> <chr>
#>  1     Luke Skywalker    172    77   male   Human other
#>  2              C-3PO    167    75   <NA>   Droid robot
#>  3              R2-D2     96    32   <NA>   Droid robot
#>  4        Darth Vader    202   136   male   Human large
Old Faithful
Exploring Old Faithful goals
- Make the histogram shown in the book with the black and white theme and an improved x-axis label.
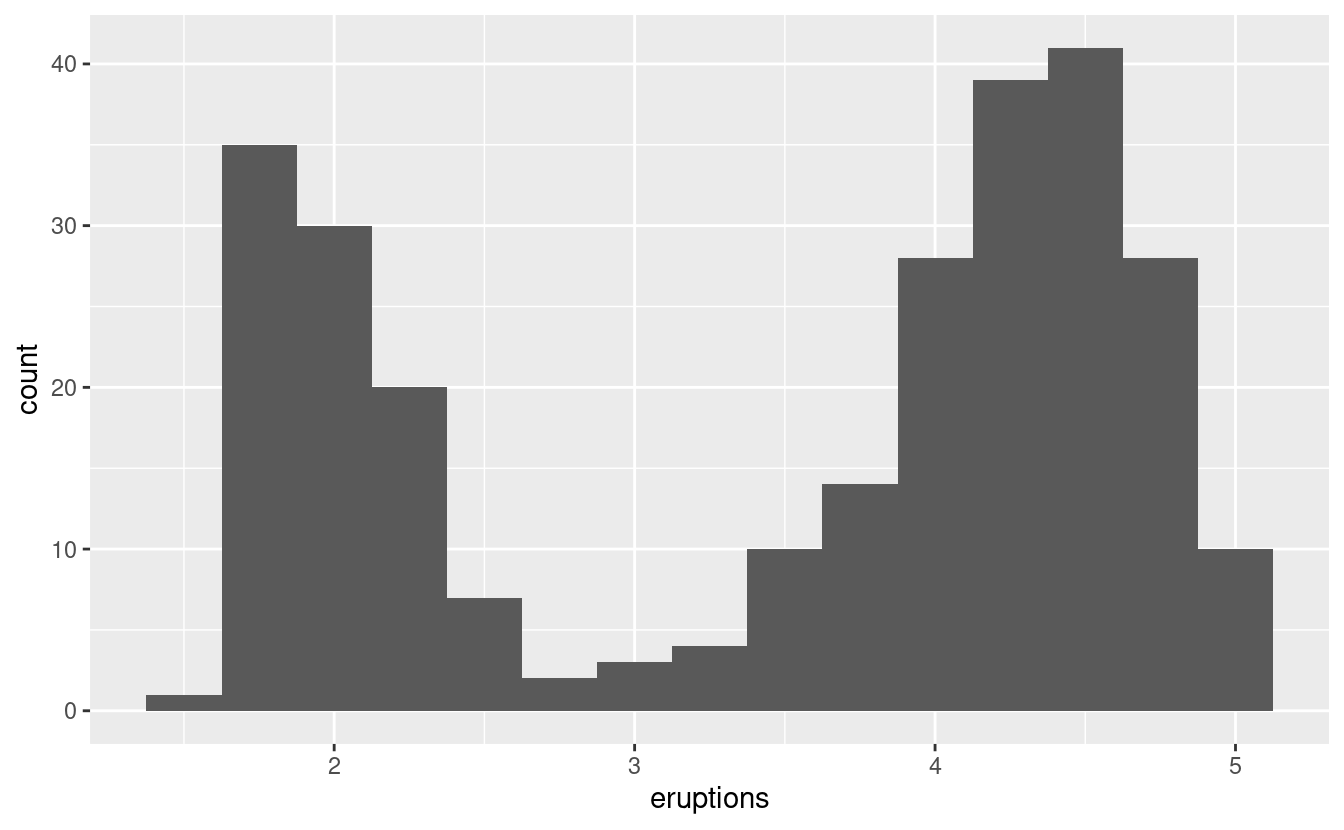
Exploring Old Faithful (1)
Exploring Old Faithful goals (2)
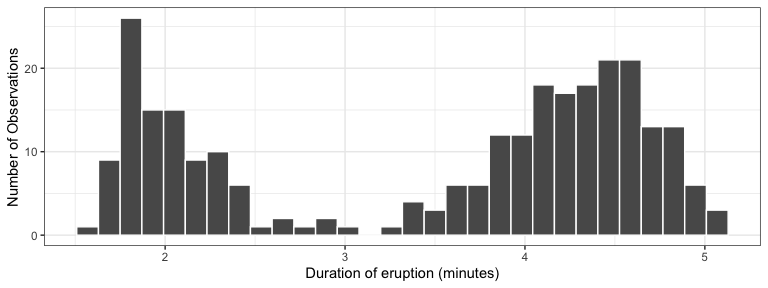
- Make the histogram shown in the book with the black and white theme and an improved x-axis label.
- Use the mutate function to modify our plot to fill the histogram for two groups of waiting times.
Exploring Old Faithful (3)
Exploring Old Faithful goals (4)
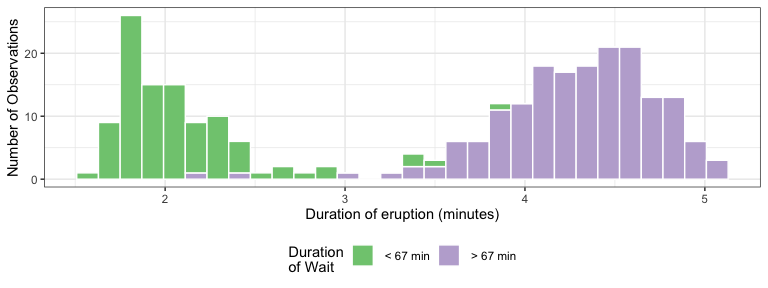
- Make the histogram shown in the book with the black and white theme and an improved x-axis label.
- Use the mutate function to modify our plot to fill the histogram for two groups of waiting times.
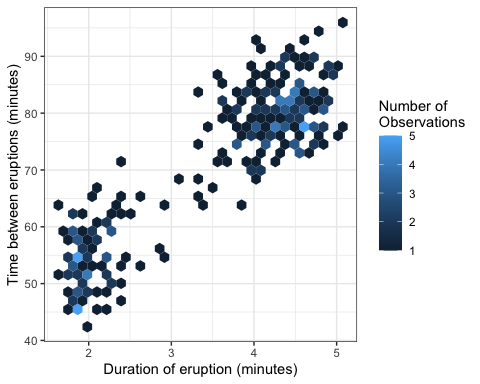
- Use the waiting variable to make a hexbin plot of the relationship between waiting time and duration.
Exploring Old Faithful (5)