Moving Time Part I
J. Hathaway
Questions about lubridate
R-Studio Connect and Interaction
Setting up R-Studio
Time to set up our R-Studio to share interactive documents.
- https://shiny.byui.edu in R-Studio
Viewing on the website.
- view with shiny.byui.edu
Example: library(DT) - DataTables
Make a new Rmd file that just has the following in it (including the default yaml).
Putting information in your file My interactive
Team Discussion
Case Study 8: It’s about time
Case Study 9: Interacting with time
Task 17: My investment is better than yours
Try: library(DT) - DataTables
Look at the DT: An R interface to the DataTables library website and find one or two modifications that you could make to your table output to move beyond the default.
- Work as a table and push one file to R-Studio connect.
- Make sure everyone at the table has the code saved on their computers.
Being Readings
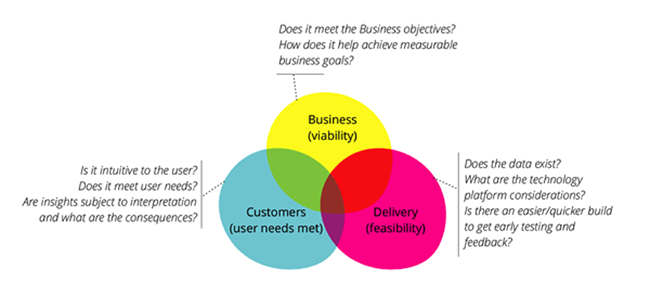
The development diagram
Improving literacy
- How do we improve literacy?
- Show the graphic narrative example.
Time Series Data
Are we using timetk?
Looks like the task doesn’t require it. I wanted you guys to see this package and understand the potential if you need it in the future - Link.
tibles, ts, xts, and zoos oh my!
Use the links on this page to try and describe what ts, xts, and zoo formats are in R?
We are not going to take the time to get into the weeds of xt, xts, zoo. Here are two locations where you can read till your heart is content - 1, and 2.
Really matrix formats
Q: Why is xts implemented as a matrix rather than a data frame?
xts uses a matrix rather than data.frame because: 1) xts is a subclass of zoo, and that’s how zoo objects are structured; and 2) matrix objects have much better performance than data.frames.
Why xts?
Q: Why should I use xts rather than zoo or another time-series package?
The main benefit of xts is its seamless compatibility with other packages using different time-series classes (timeSeries, zoo, .). In addition, xts allows the user to add custom attributes to any object. See the main xts vignette for more information.
Settling In
Remember the Goal
“The most exciting phrase to hear in science, the one that heralds new discoveries, is not ‘Eureka!’ but ‘That’s funny…’” -Isaac Asimov
- Remembering Good Principles
- Rauser view on time and data - 10:28 to 17:50
Edward Tufte
Graphical excellence is that which gives to the viewer the greatest number of ideas in the shortest time with the least ink in the smallest space
Edward Tufte
Next Class
dygraphs: R connection to dygraphs JavaScript charting library
Open the dygraphs help website and implement one of their examples in your local R session.