Goodness of fit
Good Reads
Supplemental Reading
Chi-Squared Goodness of Fit Test
Goodness of Fit (Google Sheet)
The counts and percentage of last digits for college students asked to pick random numbers
Let’s try our goodness of fit tool
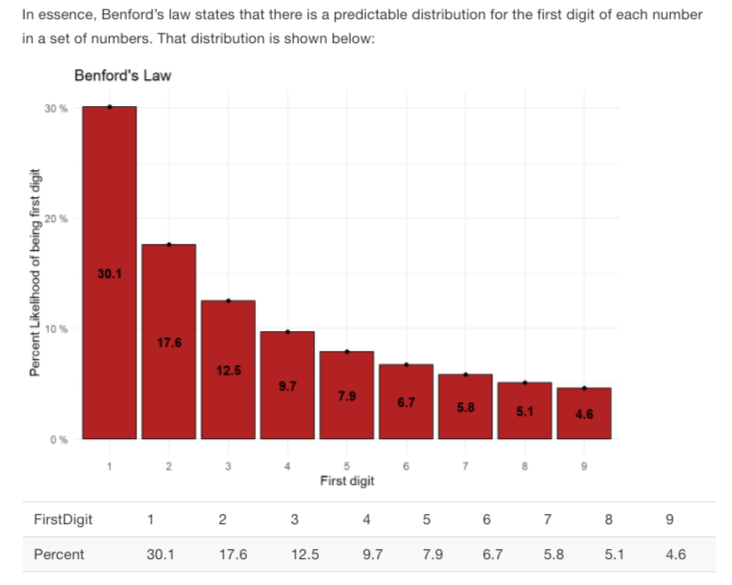
Understanding Benford’s distribution
Statistical tests and visualizations
- Let’s use the benford_data4 file and look at the cities data in the data column.
Expected count under Benford’s law (Tableau Calculated Field)
sum([Benford Percent]) * TOTAL(sum([N]))A data frame with columns:
- data - The data object used to calculate digit counts
- country - The location or group within each data object
- first - The first digit number
- n - The count of numbers that started with that digit
- percent - The percent of the total for each data and country group
- benford_percent - The expected proportion under Benford’s law
Tableau Calculated Field
Statistical Power & The Chi-Square Distribution
The Chi-Square test is not very powerful. When in fact the the Null Hypothesis is wrong, the test can’t tell it is wrong. All tests can tell the difference with enough samples. Statistical power is a key element in driving a sample size.
Case Study
Catch me, if you can?
Background
You have recently been hired by the U.S. internal revenue service (IRS) to catch corporate cheaters. You have been given three companies to investigate. You will need to decide if the IRS should build a legal case to investigate the institution for fraud.
- Sino Forest Corporation: You have the values from the financial statement numbers of Sino Forest Corporation’s 2010 Report.
- Government Entity: A dataset containing the card transactions for a government entity - 2010.
- General Motors: The amounts paid to vendors for the 90 days preceding General Motor’s 2009 liquidation.
Our challenge
You will be responsible to report as much evidence as you can with the data provided for each institution above. The government entity has more available data than the other two which will require you to dig deeper to find additional clues.
You can find varied data sources available for your use on the data page in Canvas. You will need to use more than one of the data sets provided but you are not expected to use them all,
Deliverables
- A 8-12 slide presentation to your IRS managers on the case against each entity.
- At least one slide that shows the statistical test results from the analysis you performed.
- At least one slide per institution that visualizes their first digit distribution compared to Benford’s law.
- At least one slide for one of the institutions that compares the last digit distribution to what would be expected.
- Multiple visualizations of the Government Entity data to find other interesting insights.