Comparing variables

Supplemental Reading:

Section 4.5 Chi-Squared Test of Independence

  • Explain the null and alternative hypothesis without using the words from the book.

Scatterplots with two measures

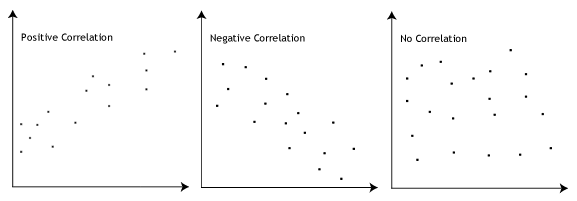
Finish the following sentences for comparing two measures

  • Positive Correlation: As x increases y ________.
  • Negative Correlation: As x increases y ________.
  • No Correlation: As x increases y _________.
  • If there is a relationship between x and y then knowing x gives us information about y.

Tables with two dimensions

Let’s think about our counts of birth by month and sport data.

  • Does being in a professional sport provide information about what month they were born in?
  • If yes, they are correlated or their is a relationship. They are not independent
  • if no, then birthday months are independent of what sport a professional plays.

Case Study

Building our data tables (Tableau)

  1. Build a table that shows the sum of all births for each group and each month.
  2. Build a table that shows the percentage of births by month within each sport. A. Edit table calculations
  3. Build a table that has the counts for the US and Baseball for July and August. A. Filter

Cut off dates

  • Baseball: July 31st
  • Football: July 31st (but it has weight limits and other dates)
  • Basketball: August 31st (but it has other dates)
  • Hockey: December 31st

Comparing with two group proportions?

  1. How could we compare US births to Hockey births to see if there is a Matthew effect?
  2. What are some other ways we could compare the two groups?
  3. Which is better?
  4. What concerns do you have?

Comparing multiple variables over two populations?

  • If the Matthew effect is real, why would it only happen in certain months. Should we see a trend?
  • What are the benefits of comparing the entire trend?
  • Now that we see a difference, what would we want to do?

Why does Basketball not have a Mathew effect?

Can’t coach height

Why does US Football not have a Matthew effect?