From data decision to population decisions
Case Study
Do birthdays matter?
- Build a 6-10 slide presentation that provides data visualizations to pair up with the text from Malcolm Gladwell’s chapter on the Matthew Effect.
- At least one slide should have a visualization that compares the US population of births to a sport of your preference with persuasive annotations added to the graphics.
- At least three slides should describe and show the statistical comparison you performed to provide justification for your inference.
- Your final slide should have your conclusions beyond the observed data.
Good Reads
Present to Persuade (Pgs. 192-208)
One million, six million, seventy million. Spoken or written, these numbers become a buszz. Incomprehensible. Presented graphically, they hit closer to the heart. As the Soviet losses climbed, I thought my browser had frozen. Surely the top of the column bust have been reached by now, I thought.
- See minute 6:05 http://www.fallen.io/ww2/
Present to Persuade Summary
- Show the chart and stop talking
- Don’t read the picture
- For unusual visual forms, guide the audience
- Use reference charts
- Show something simple, leave behind more detail
- Tell stories
Supplemental Reading:
The statistical tools Google Sheet
https://docs.google.com/spreadsheets/d/1MKIIJ6bi0tQSvSvqvbimGxy9TredQAUhd3XGTDl_QNQ/template/preview
https://byuistats.github.io/CSE150/ then under tools.
Section 4.1 Introduction to Inference
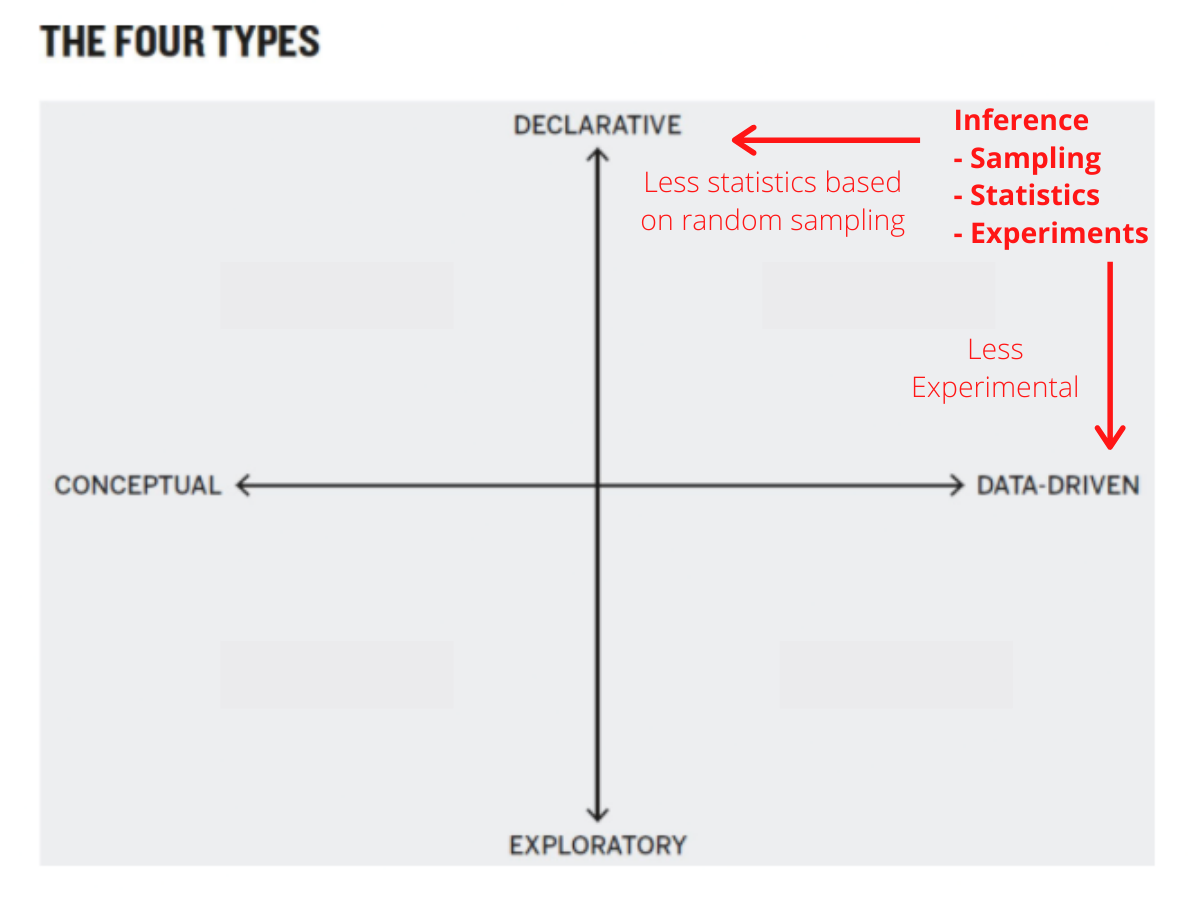
Connecting Inference to Good Charts
- Is the information conceptual or data driven?
- Am I declaring something or exploring something?
Hypothesis Testing
Who can explain hypothesis testing in 1-2 sentences?
Fisher’s Tea Experiment
- Fisher wondered whether Bristol had simply gotten lucky and guessed correctly all eight times. He worked out the math for this possibility and realized the odds were 1 in 70. So she probably could taste the difference. ref
Setting up the Tea bet
- What is the Null hypothesis?
- What is the alternative hypothesis?
- What proof is needed to persuade us of one hypothesis or the other?
Fisher’s follow on questions
- What if she’d switched two cups around, incorrectly identifying a tea-first cup as a milk-first cup and vice versa? Can she still tell the difference?
- Would 12 coups instead of eight cups have been a better test? Why?
- What if she was only given two cups and correctly identified both, could we conclude that she had the ability to taste the difference?
What is a p-value
What does it mean to assume something is true?
- What do you think the implications of the statement, ‘The null hypothesis is always assumed to be true.’ is with respect to hypothesis testing?
- Example 1:
- What is the least someone could weigh and still be healthy?
- Assuming the person is 4 foot tall, what is the least they could weigh and be healthy?
- Assuming you are 7 foot tall, what is the least you could weigh and be healthy?
- Example 2:
- Assuming you are a criminal, should you go to jail?
- Example 3:
- If someone asks, “Are you stupid or dumb?” what is the assumption?
The Father of Statistics: Fisher
Fisher published the fruit of his research in two seminal books, Statistical Methods for Research Workers and The Design of Experiments. The latter introduced several fundamental ideas, including the null hypothesis and statistical significance, that scientists worldwide still use today. And the first example Fisher used in his book—to set the tone for everything that followed—was Muriel Bristol’s tea test.