Normal Distribution and Z-scores
Good Reads
Chapter 6: Refine to impress (Pg. 143-152)
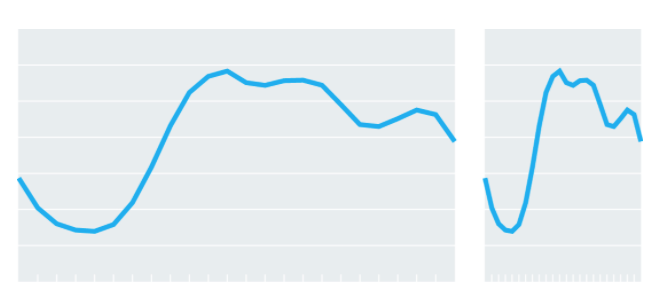
- Every chart is a manipulation.

Supplemental Reading
Chapter 2: Introduction to the Normal Distribution and Z-scores
- Computing Z-scores: Who has a more atypical height?
- 68-95-99.7 Rule
- Standard Deviation Estimation