Data vs. Summaries
Good Reads
Chapter 4: Better Charts in a couple of hours (87-108)
Supplemental Reading
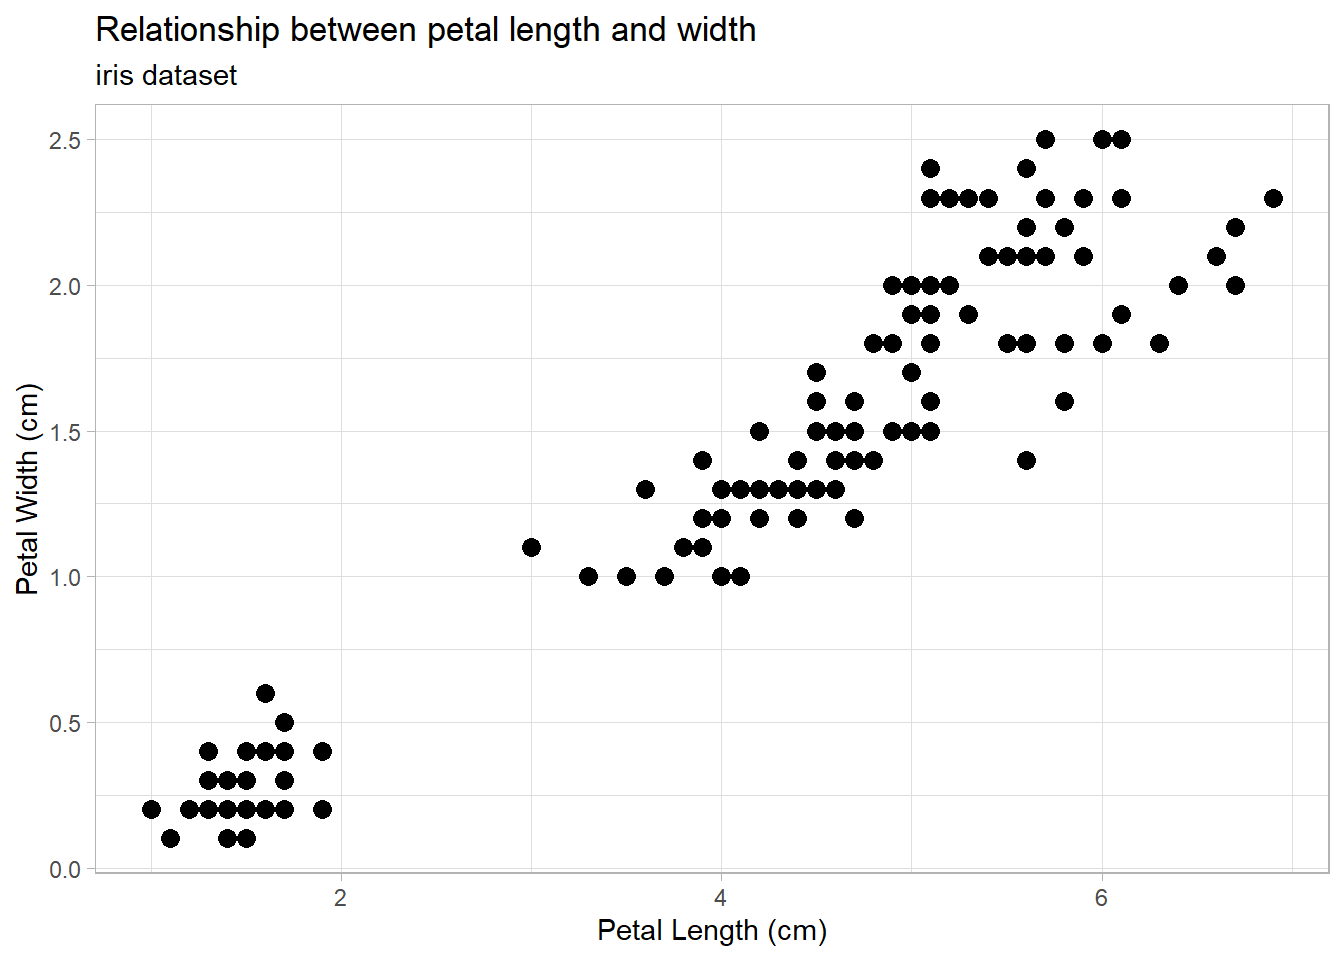
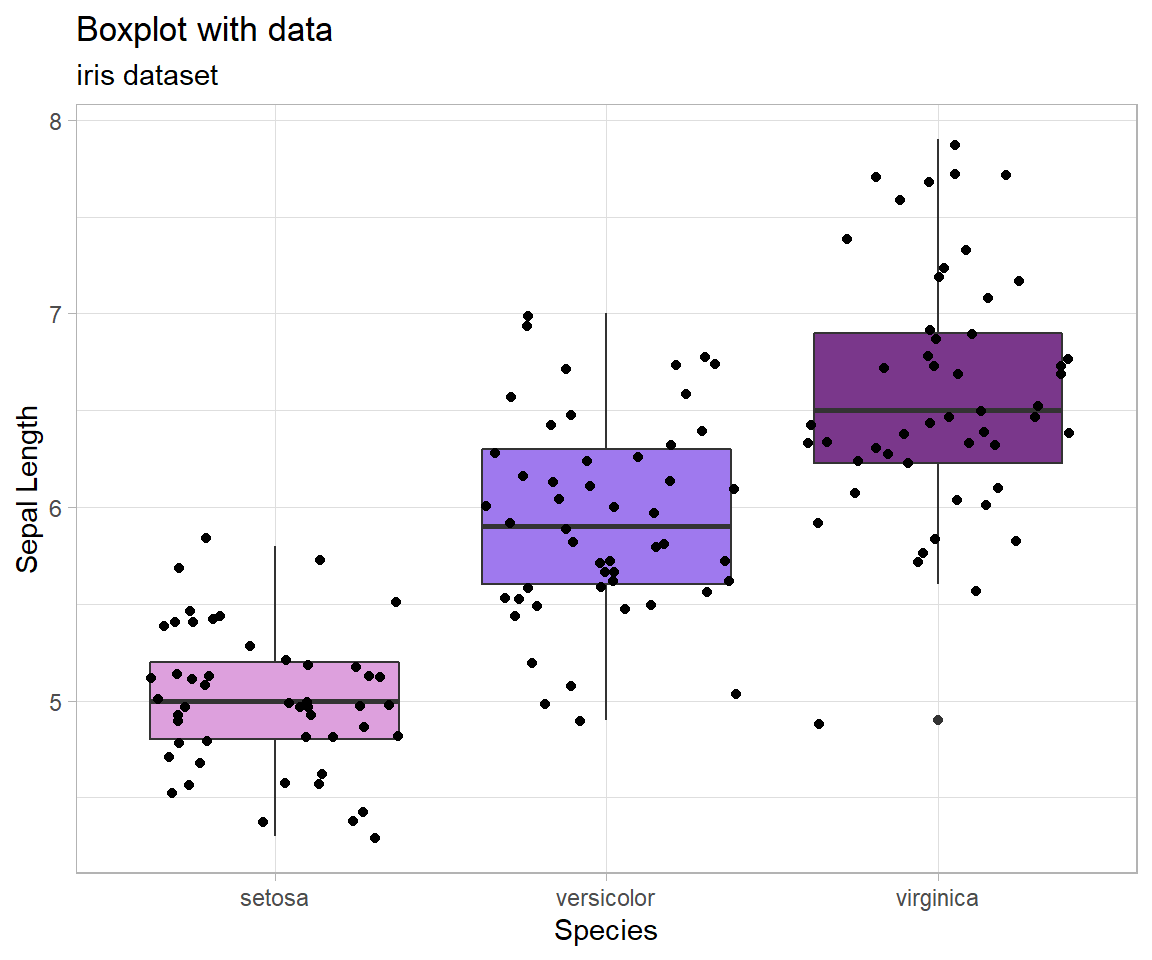
Graphical Summaries
Are all of these graphical summaries?
Numerical Gestalt
Gestalt: an organized whole that is perceived as more than the sum of its parts.
Saul has slain his thousands. And David his ten thousands (1 Sam. 18.7).
Cassirer observes, … the owner of a herd of four to five hundred cattle could recognize even at a distance whether any were missing and which ones. Here individual groups are recognized and differentiated by some individual characteristic: in so far as one can speak of ‘number’, it appears not in the form of a specified measured magnitude, but as a kind of concrete ‘numerical gestalt’, an intuitive quality adhering to a totally unarticulated general impression of quantity. Hebrew Thought Compared with Greek (Pg. 166)
Tableau Questions
Activity
How are we doing on data entry?
- Can you share your data sheet to show the class?
- Thinking about this process as representative of all data creation, what did you learn?
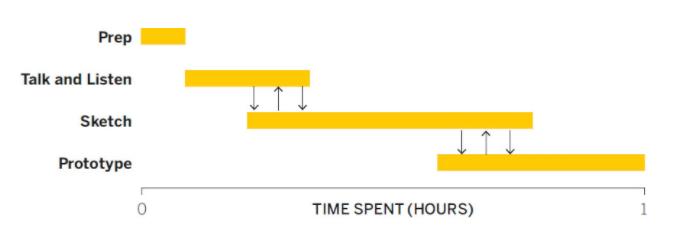
Talk/Listen and Sketch
- With your partner, go to a white board and talk about what you think you need to show.
- Write down a few bulleted questions that you think a customer will be asking when they decide on a bag.
- Now, try to sketch on the white board a few charts that use your data to answer those questions. Visualisation Catalog
- Let’s build one of the charts in Tableau.