Using ggplot2, Data Import, & Scripts
J. Hathaway
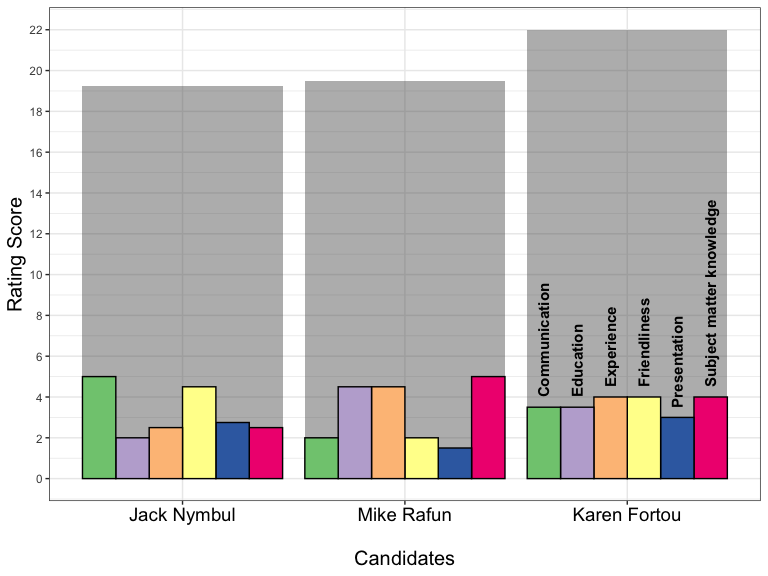
Becoming the Critic.
My Attempt at a graphic
Virtual Questions and Support
- How is slack working?
- Threaded conversations
- Two channels for help?
- Stack Overflow vs Slack post
- Quick help vs detailed support
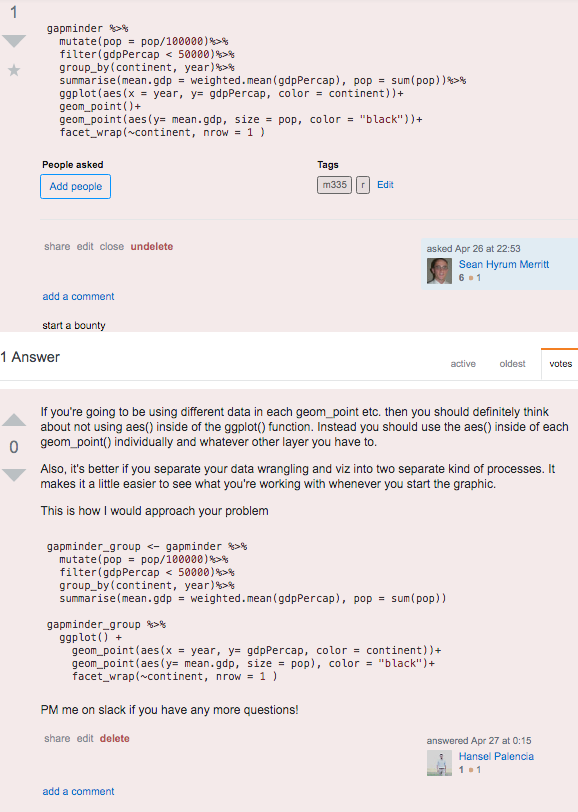
Example of what not to ask on Stack
Getting the Routine Down
- I am expecting pushes to happen at least three times a week
- Leadership Task
Review the reading
Write this chunk of code out in an English sentence to your grandma. Submit it on Socrative.com. Use BYUICLASS for the roomname.
Being Readings
How does data change belief?
To understand God’s thoughts we must study statistics, for these are the measure of His purpose.
-Florence Nightingale (Coxcomb graph)
Her most famous graph, displayed at the top of this article, shows the number of soldier deaths per month from various causes. Each pie slice represents a different month, from April 1854 through March 1856, and each color stands for a different cause of death. It takes just a quick glance to achieve the two main takeaways: that disease, colored blue, killed far more soldiers than either “wounds” (red) or “other” (black), and that it was reduced greatly in 1855.
What changed Britian’s mind?
After she completed her report, Nightingale worked hard to turn its conclusions into common knowledge, privately distributing it to influential people and writing several more reports, many of which included coxcombs. When she received push back from Army doctors, who thought sanitary measures a waste of money, she even leaked some of her charts to the press.
Hans
It is only by measuring that we can cross the river of myths.
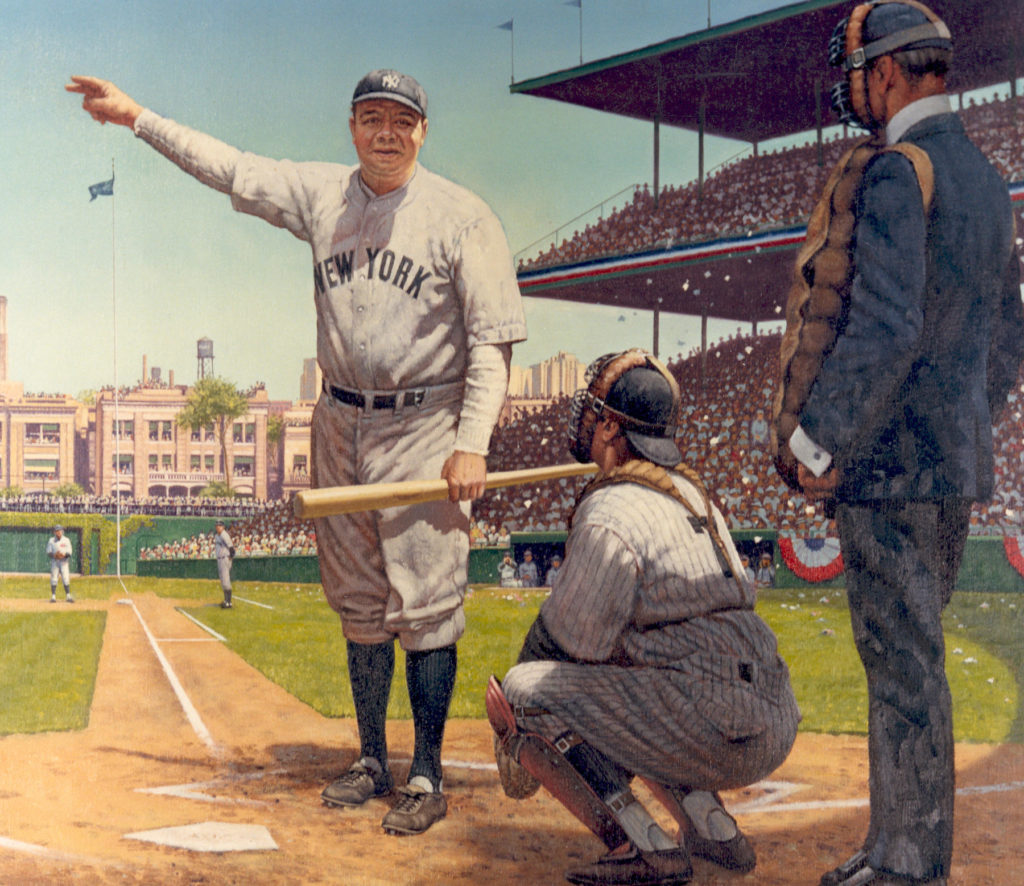
Call your shot
Builds skills and experience from classes. Don’t take classes! Here is the real image
Team Discussion
Case Study 2: Wealth and Life Expectancy (Gapminder)
Case Study 3: Becoming a databender
Task 5: World Data Investigation
Data Ingestion
Data formats
If there is a data format that exists and is used, then there is a way to import that data into R. We will learn how to handle the basic tabular formats. The following packages will provide most of the functionality we need.
library(readr)library(readxls)library(haven)
Understanding file types
- What is an ASCII file?
- Which of the following file formats are not ASCII?
.csv.html.txt.R.xlsx.Rmd.doc
Data Import (task 5)
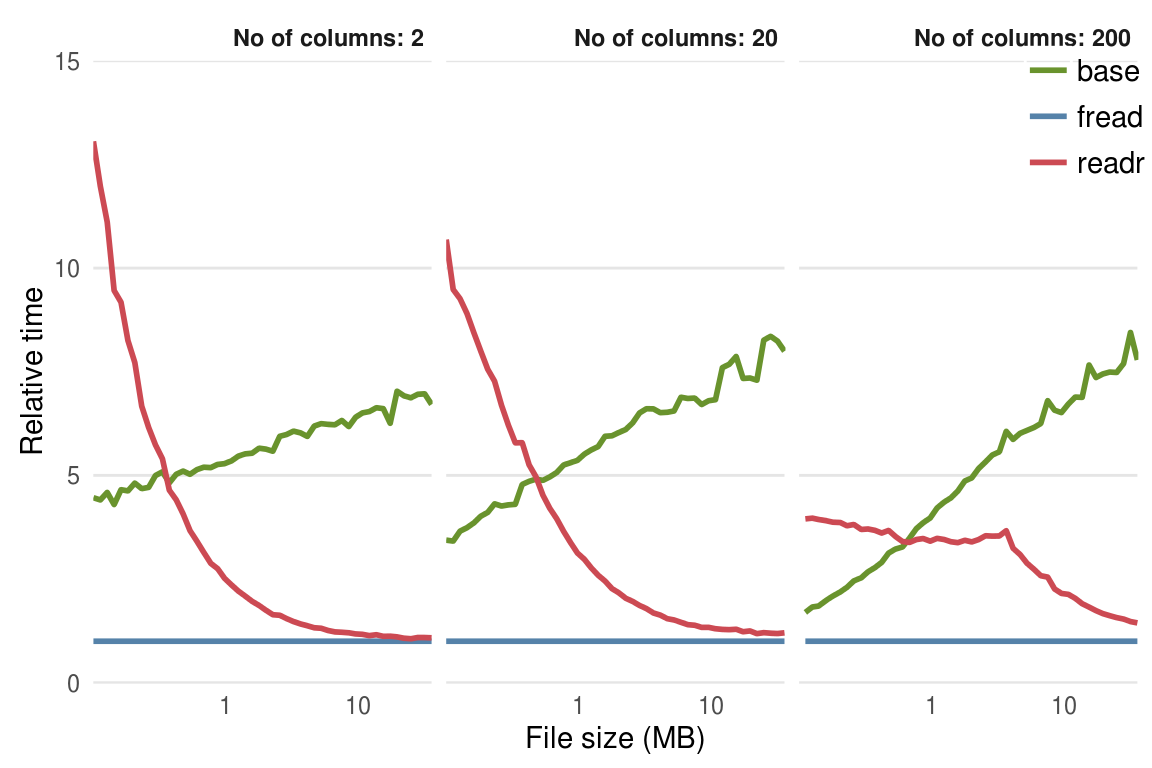
- What is the difference between
read.csv()andread_csv()? - Read this link (5.3.1) and take some time to make a note in your task 5
README.mdin your repository about the benefits. - Push your updated
README.mdfor me to read in class. - Good Image
parse_ commands
Use this code
money <- c('4,554,25', '$45', '8025.33cents', '288f45')- Apply
as.numeric(money)and talk with your table about the output. - Apply
parse_number(money)and compare the results.
Using read_csv() with parsers
- Run this line of code below
- Look at the errors (
problems(challenge)), thehead(), andtail()of yourchallengeobject. What formats should they be? - Now review 11.4.2 of our textbook and
?read_csv()to fix the read in.
Scripts
Here are a few questions. Discuss each one with your table and decide which file type to use - .md, .r or .rmd. Then discuss the reasons for that decision.
- I have a short memo to write for my boss that will not have any r code included.
- I am working out some example R code to make sure I understand what it is doing (see this for a twist).
- Brother Hathaway has some code snippets that he wants us to learn in class.
- I have a report that I need to write which will include some writing and analysis.