Moving in Space and Gestalt
J. Hathaway
gestalt: an organized whole that is percieved as more than the sum of its parts.
Team Discussion
Case Study 9: Interacting with time
Case Study 10: Building the past
Task 19: Spatial Data and Measure Data
“Big” Data (Josh Wills)
Scientists Vs. Analysts (Josh Wills)
- Best way to differentiate a data scientist from a data analyst.
- Data Analyst: If my tools and data can’t answer a question, then the question doesn’t get answered.
- Data Scientist: If my tools and data can’t answer a question, then I go get better tools and data.
Leaving your little computer (Josh Wills)
Geospatial Data
McNamara on Mapping
- Minute 2:45 - Gelman on maps and variables
- Minute 11:15 - Modifiable areal unit problem
- Minute 12:15 - Histogram example
- Minute 14:20 - John Oliver on Gerrymandering has some crude language after 6 minutes.
- Minute 14:20 - Washinton Post on Gerrymandering
- Minute 17:00 - The redistring game
- Minute 18:00 - Talismanic Redistricting
- Minute 20:00 - Dasymetric Maps
- Minute 21:20 - Mapping upscaling interactive example
- Minute 22:25 - Side Scaling: Nested Polygons and redrawing the states
- Minute 23:20 - Misaligned Polygons and Flint. Zipcodes are problematic.
- Minute 26:19 - Tobler’s First Law
- Minute 26:30 - Pycno Package
Gelman’s Conclusion
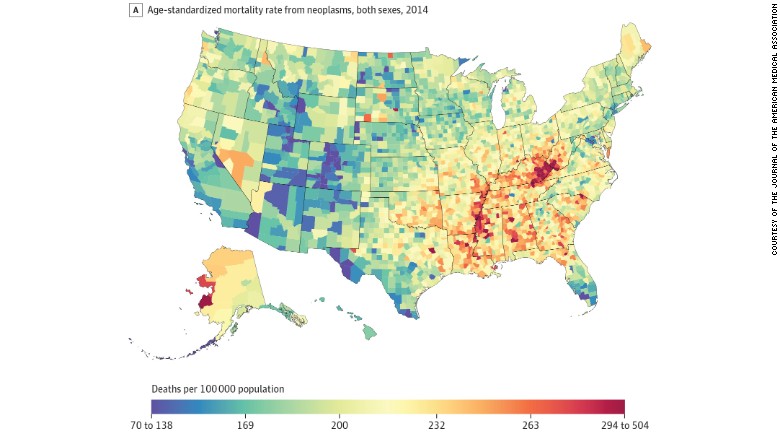
Mapping raw data can lead to spurious spatial features. For example, regions can appear highly variable because of small sample sizes in spatial sub-units (as in the radon example) or small populations (as in the cancer example), and these apparently variable regions contain a disproportionate number of very high (or low) observed parameter values
Furthermore, maps really do make convenient look-up tables (what is the cancer rate, or mean radon level, in my county?). Unfortunately, even maps that are intended to be used only as look-up tables are almost sure to be used for identifying spatial features – we find it very hard to suppress this instinct ourselves
How have we dealt with maps?
Is the earth flat?
Kyrie Irving was trending on Twitter today because he believes the Earth is flat. I asked him about it. pic.twitter.com/ODe9aP9qmK
— Arash Markazi (@ArashMarkazi) February 18, 2017
Do people believe him?
Uh oh: Draymond is a Flat Earth/Kyrie Truther. pic.twitter.com/icJThyG7hx
— The Crossover (@TheCrossover) February 18, 2017
Which area is larger - The continental 48 states or the country of Brazil?
- While a few basketbal players may think the earth is flat, is education feeding us stuff that isn’t true?
- Boston has concerns about our map education
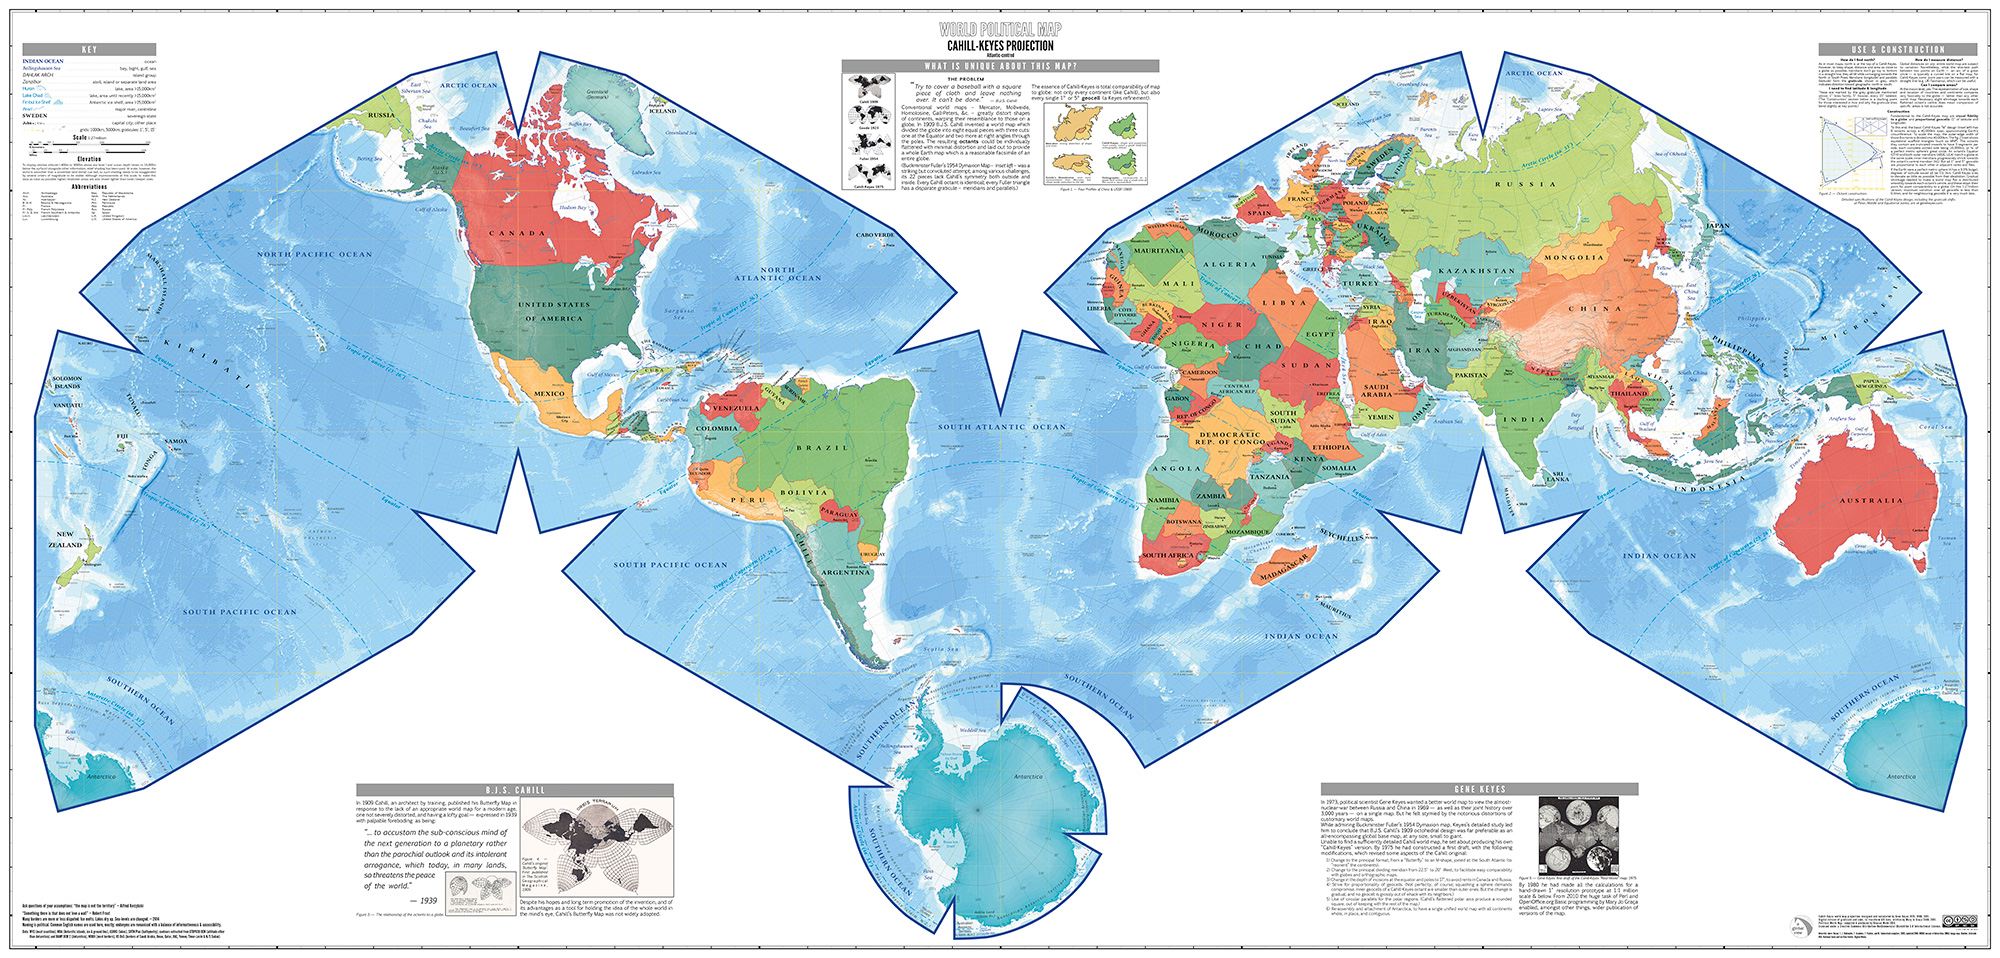
What are projections?
- Which map is correct?
- Which map shows area correctly?
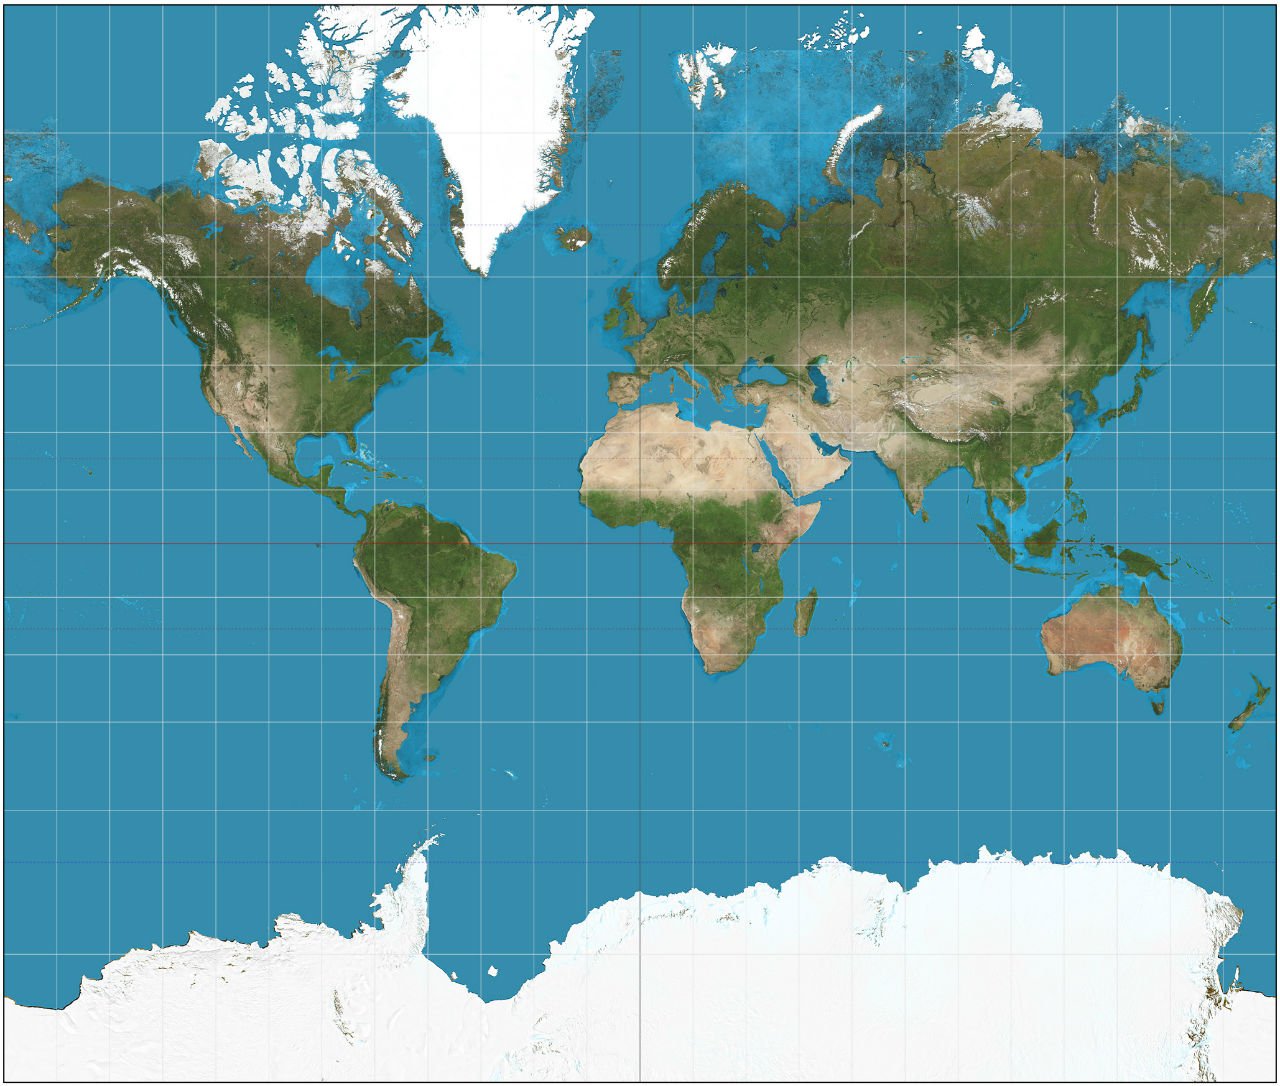
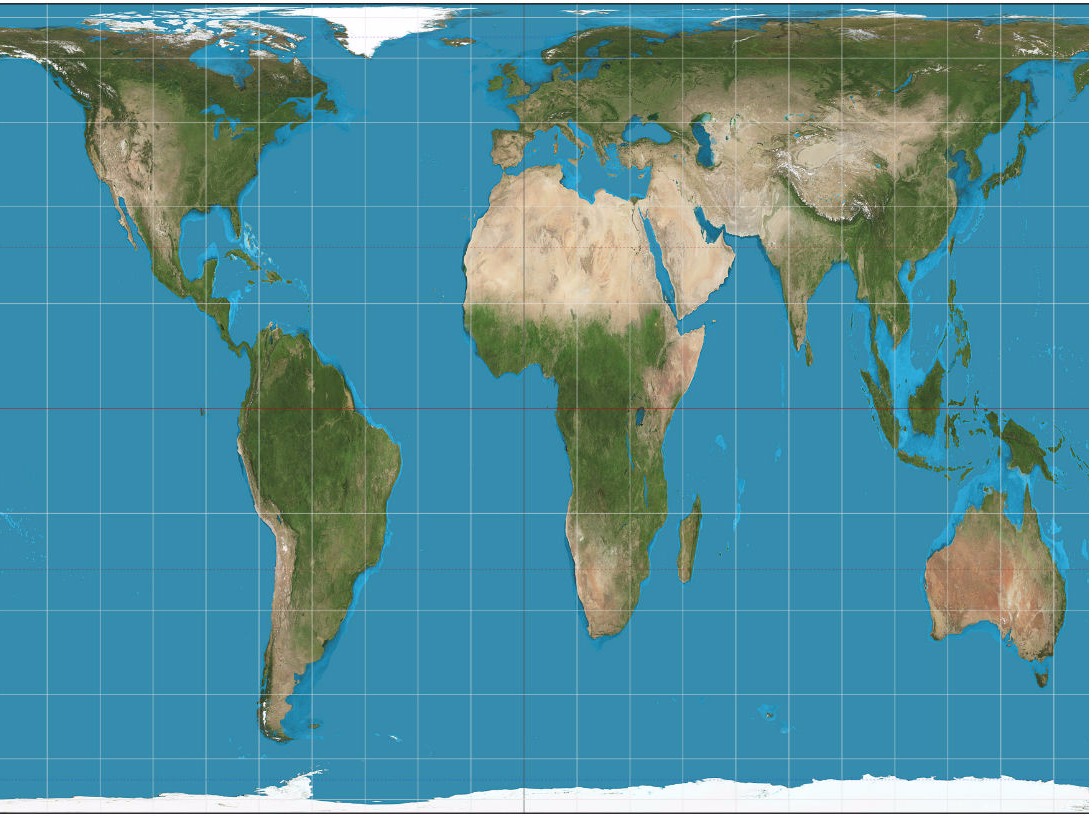
When we make a map, what is our goal?
What is GDAL?
The Geospatial Data Abstraction Library (GDAL) is a C/C++ geospatial data format translation programming library and associated set of utility programs built using the library. GDAL is one of the jewels of the open source community, and I want to help you understand how to leverage its power to process spatial data.
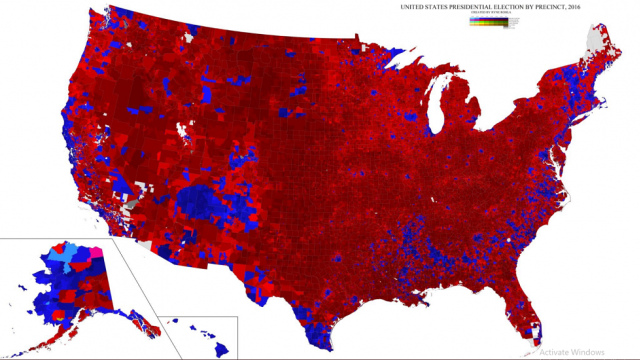
Maps Vs. Variables
What is wrong?
“Here, you can take that, that’s the final map of the numbers,” Trump said, according to Reuters. “It’s pretty good, right? The red is obviously us.” 1
How could we spatially depict the variable of interest?
geofacet challenge
Use the geofacet package to build a map that depicts the important variables more than the spatial area.
- Will need to aggregate your data to the state level.
- Will need to use
install.packages("geofacet")and thefacet_geo()function.
Checking out some results
- Who has pushed their graphic?
- Check these out