---
title: "Moving in Space and Gestalt"
author: J. Hathaway
params:
day: 19
ptitle: true
pbackground: true
dtype: "none"
---
```{r setup, include=FALSE}
knitr::opts_chunk$set(echo = TRUE, message = FALSE, warning = FALSE)
if (params$day %% 2 == 0) md_intro_format <- "even_intro_format.Rmd"
if (params$day %% 2 == 1) md_intro_format <- "odd_intro_format.Rmd"
```
# gestalt: an organized whole that is percieved as more than the sum of its parts. {data-background=#e8d725}
```{r child=md_intro_format}
```
# "Big" Data (Josh Wills) {data-background=#e8d725}
## Scientists Vs. Analysts (Josh Wills)
> - Best way to differentiate a data scientist from a data analyst.
> - **Data Analyst:** If my tools and data can't answer a question, then the question doesn't get answered.
> - **Data Scientist:** If my tools and data can't answer a question, then I go get better tools and data.
## Leaving your little computer (Josh Wills)
> - [The science is the idea and then data moving to answer](https://www.youtube.com/embed/Ewd5PXgLXlU?start=488)
> - [Big is different in many ways](https://www.youtube.com/embed/Ewd5PXgLXlU?start=690)
# Geospatial Data {data-background=#e8d725}
## McNamara on Mapping
> - Minute 2:45 - [Gelman on maps and variables](http://www.stat.columbia.edu/~gelman/research/published/allmaps.pdf)
> - Minute 11:15 - [Modifiable areal unit problem](https://en.wikipedia.org/wiki/Modifiable_areal_unit_problem)
> - **Minute 12:15** - [Histogram example](https://tinlizzie.org/histograms/)
> - **Minute 14:20** - [John Oliver on Gerrymandering](https://www.youtube.com/watch?v=A-4dIImaodQ) has some crude language after 6 minutes.
> - Minute 14:20 - [Washinton Post on Gerrymandering](https://www.washingtonpost.com/news/wonk/wp/2015/03/01/this-is-the-best-explanation-of-gerrymandering-you-will-ever-see/?utm_term=.21dbb215a861)
> - Minute 17:00 - [The redistring game](http://www.redistrictinggame.org/)
> - Minute 18:00 - [Talismanic Redistricting](http://cho.pol.illinois.edu/wendy/papers/talismanic.pdf)
> - Minute 20:00 - [Dasymetric Maps](https://www.e-education.psu.edu/geog486/node/1866)
> - **Minute 21:20** - [Mapping upscaling interactive example](https://tinlizzie.org/spatial/)
> - Minute 22:25 - [Side Scaling: Nested Polygons and redrawing the states](https://kevinhayeswilson.com/redraw/)
> - Minute 23:20 - [Misaligned Polygons and Flint](http://theconversation.com/how-zip-codes-nearly-masked-the-lead-problem-in-flint-65626). Zipcodes are problematic.
> - Minute 26:19 - [Tobler's First Law](https://gisgeography.com/tobler-first-law-of-geography/)
> - Minute 26:30 - [Pycno Package](https://cran.r-project.org/web/packages/pycno/pycno.pdf)
## [Gelman's Conclusion](http://www.stat.columbia.edu/~gelman/research/published/allmaps.pdf)
Mapping raw data can lead to spurious spatial features. For example, regions can appear highly variable because of small sample sizes in spatial sub-units (as in the radon example) or small populations [(as in the cancer example)](https://cdn.cnn.com/cnnnext/dam/assets/170124123712-01-cancer-cluster-maps--exlarge-169.jpg), and these apparently variable regions contain a disproportionate number of very high (or low) observed parameter values
Furthermore, maps really do make convenient look-up tables (what is the cancer rate, or mean radon level, in my county?). Unfortunately, even maps that are intended to be used only as look-up tables are almost sure to be used for identifying spatial features – we find it very hard to suppress this instinct ourselves
# How have we dealt with maps? {data-background=#e8d725}
## Is the earth flat?
## Do people believe him?
https://www.boston.com/sports/boston-celtics/2017/08/23/heres-why-kyrie-irving-thinks-the-earth-is-flat
## Which area is larger - The continental 48 states or the country of Brazil?
- While a few basketbal players may think the earth is flat, is education feeding us stuff that isn't true?
- [Boston has concerns about our map education](https://www.theguardian.com/education/2017/mar/19/boston-public-schools-world-map-mercator-peters-projection)
## What are projections?
* **Which map is correct?**
* **Which map shows area correctly?**
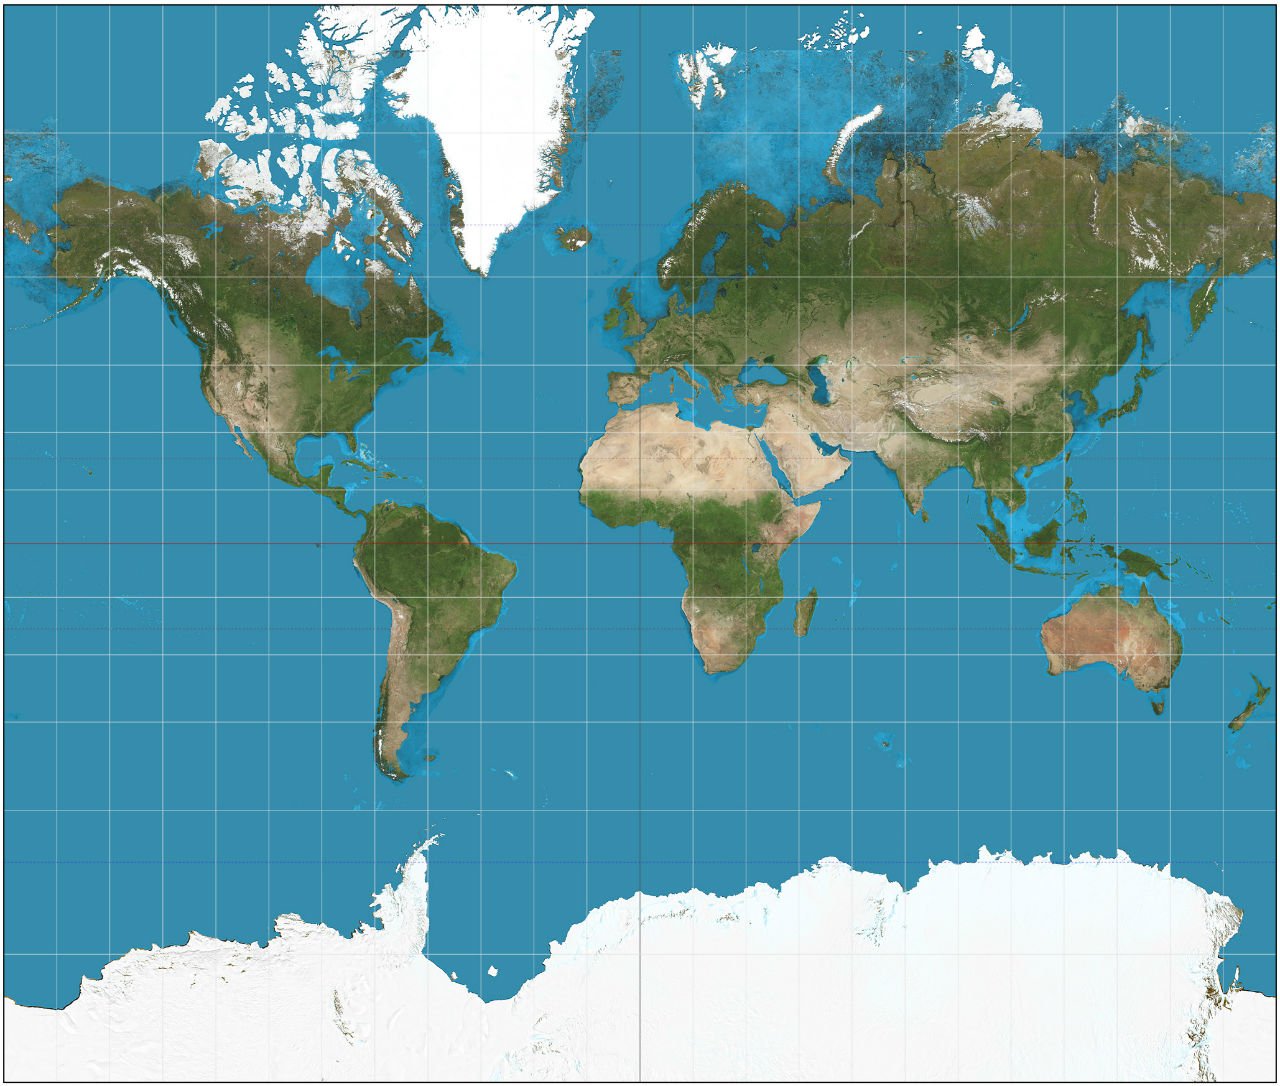{ width=40% } 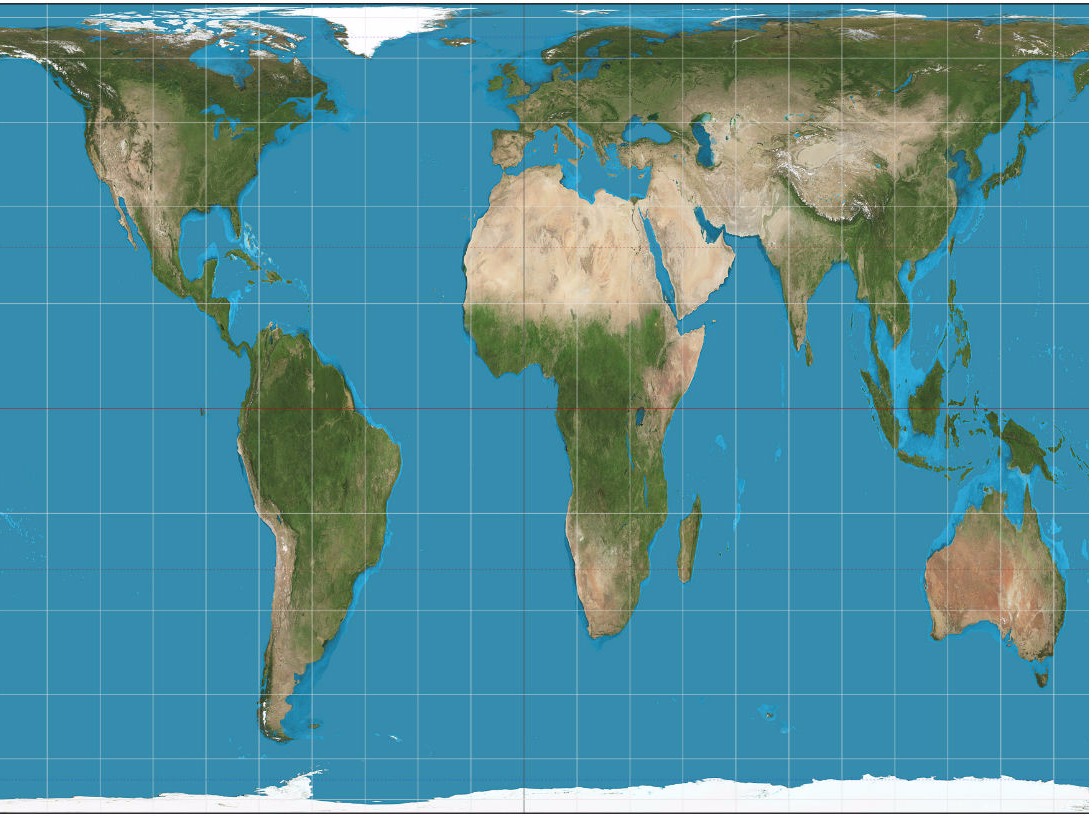{ width=45% }
## When we make a map, what is our goal?
* 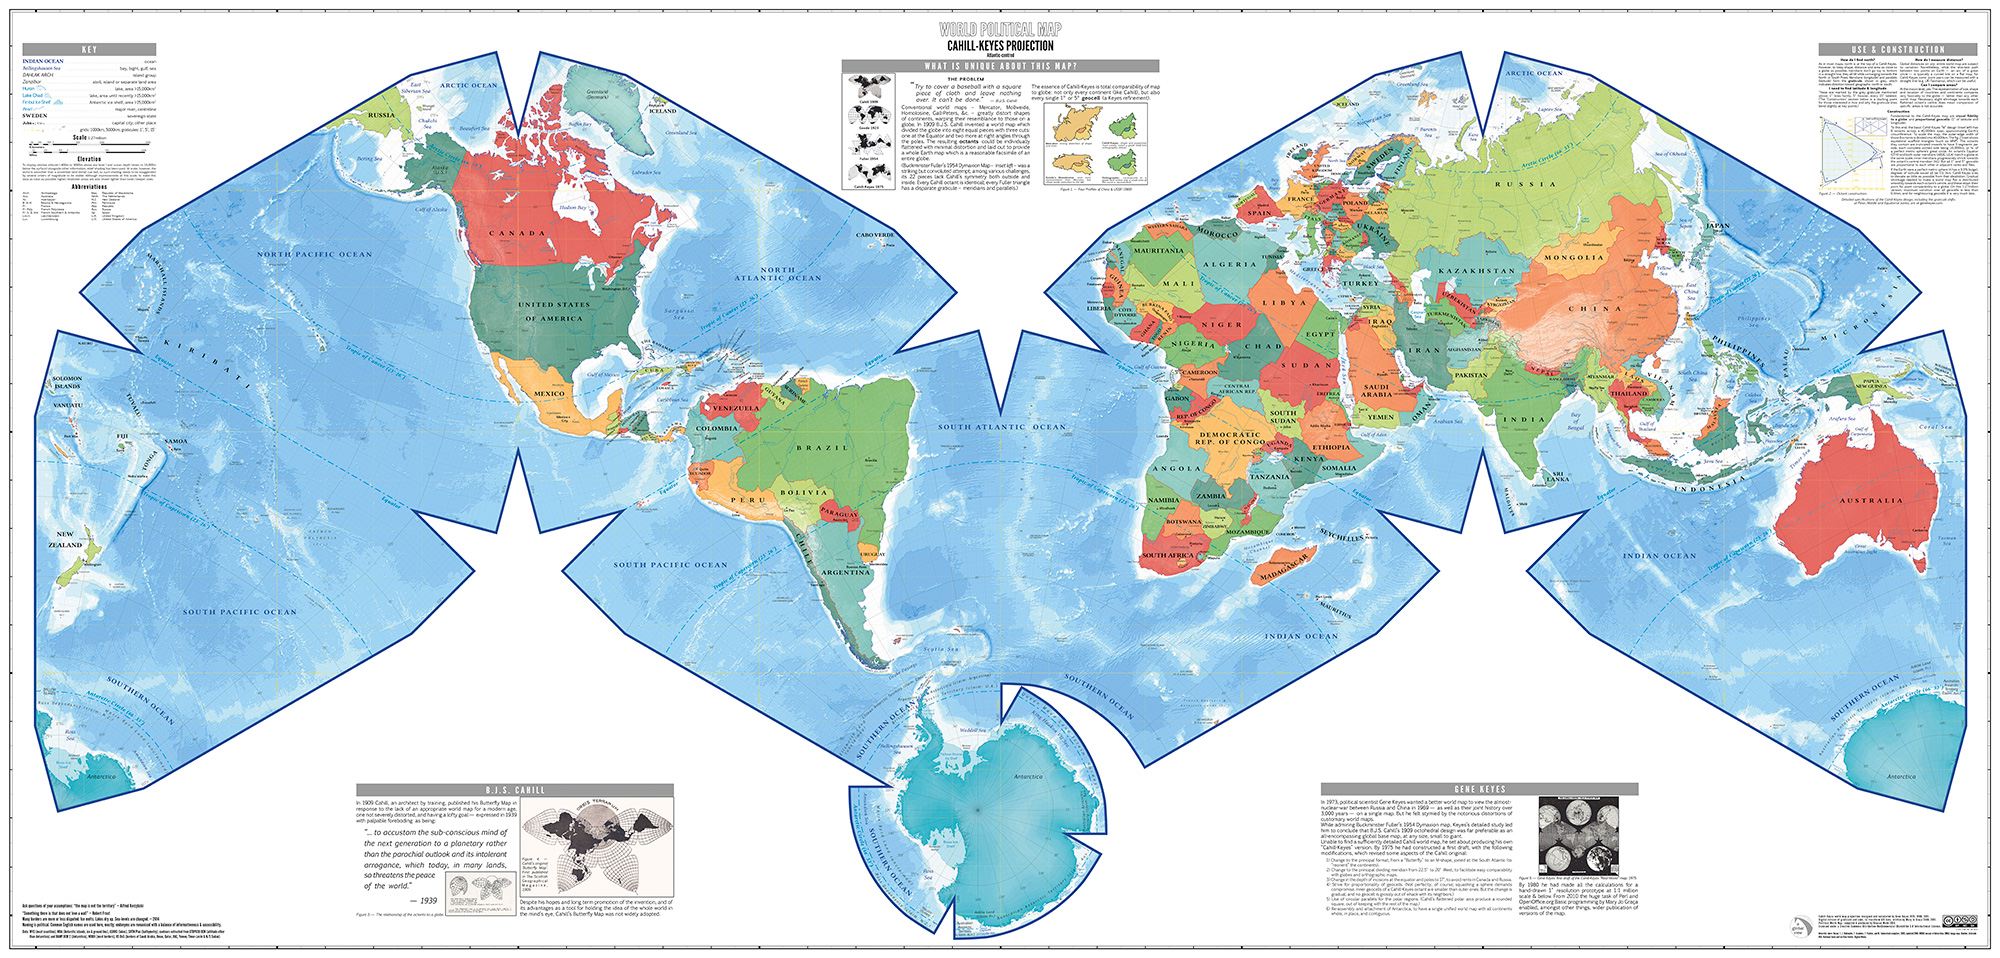{ width=80% }
* The [cahill-keyes projection looks pretty good](https://xkcd.com/977/) or [check this out](https://www.youtube.com/watch?v=sD7ED12XGFo).
## What is GDAL?
The Geospatial Data Abstraction Library (GDAL) is a C/C++ geospatial data format translation programming library and associated set of utility programs built using the library. GDAL is one of the jewels of the open source community, and I want to help you understand how to leverage its power to process spatial data.
https://en.wikipedia.org/wiki/GDAL
http://www.gdal.org
# Maps Vs. Variables {data-background=#e8d725}
## What is wrong?
"Here, you can take that, that's the final map of the numbers," Trump said, according to Reuters. "It's pretty good, right? The red is obviously us." [1](http://www.businessinsider.com/trump-2016-electoral-map-reuters-interview-xi-jinping-china-2017-4)
[Trump Map Tweet](../images/trump_map_tweet.png)
## How could we spatially depict the variable of interest?
- [Chloropleth Map](https://en.wikipedia.org/wiki/Choropleth_map)
- [Cartograms](https://en.wikipedia.org/wiki/Cartogram)
- [geofacets](https://hafen.github.io/geofacet/)
## geofacet challenge
**Use the geofacet package to build a map that depicts the important variables more than the spatial area.**
> - Will need to aggregate your data to the state level.
> - Will need to use `install.packages("geofacet")` and the `facet_geo()` function.
[data](../data/nytimes_presidential_elections_2016_results_county.csv)
## Checking out some results
- Who has pushed their graphic?
- [Check these out](http://www.businessinsider.com/2016-election-results-maps-population-adjusted-cartogram-2016-11/#heres-the-basic-electoral-college-map-with-states-that-hillary-clinton-won-in-blue-and-states-that-donald-trump-won-in-red-assuming-that-trumps-narrow-lead-in-michigan-continues-to-hold-1)