p-hats, pie charts, sample size and statistics
J. Hathaway
Lesson Outcomes
- Calculate and interpret a sample proportion
- Summarize categorical data with a bar or pie chart
- Determine the mean, standard deviation, and shape of a distribution
- Calculate probabilities using a distribution of sample proportions
Why do people make charts of data?
Socrative Quiz (BYUICLASS): L16 Data Viz questions
Pie Charts (BYUICLASS)
Bar Charts (BYUICLASS)
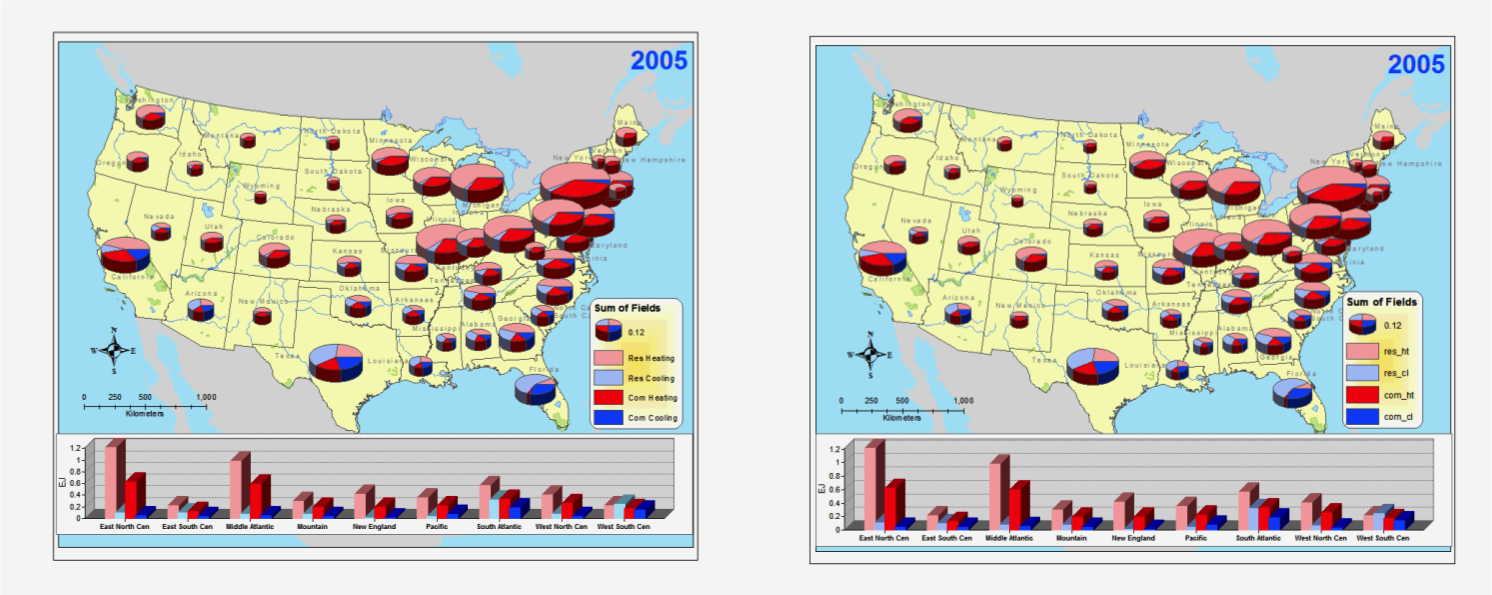
The only thing worse than a pie chart is several of them. (Edward Tufte)
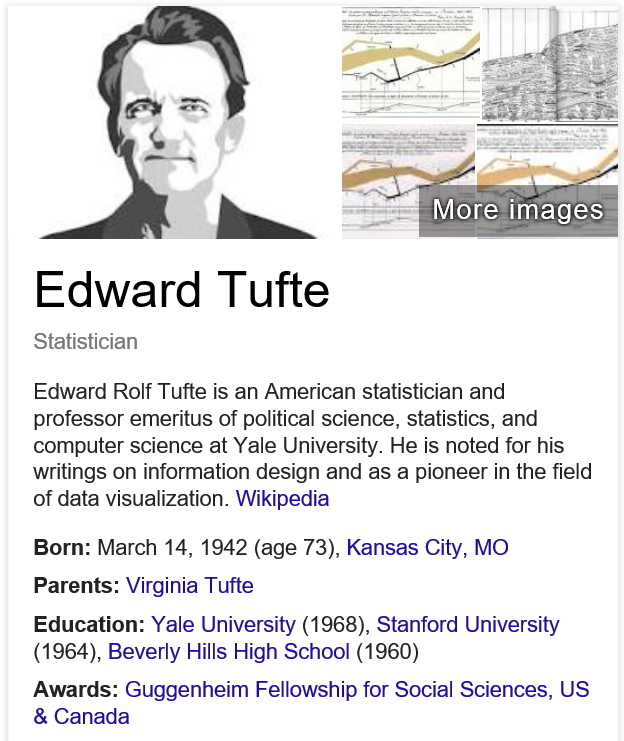
Who is Edward Tufte?
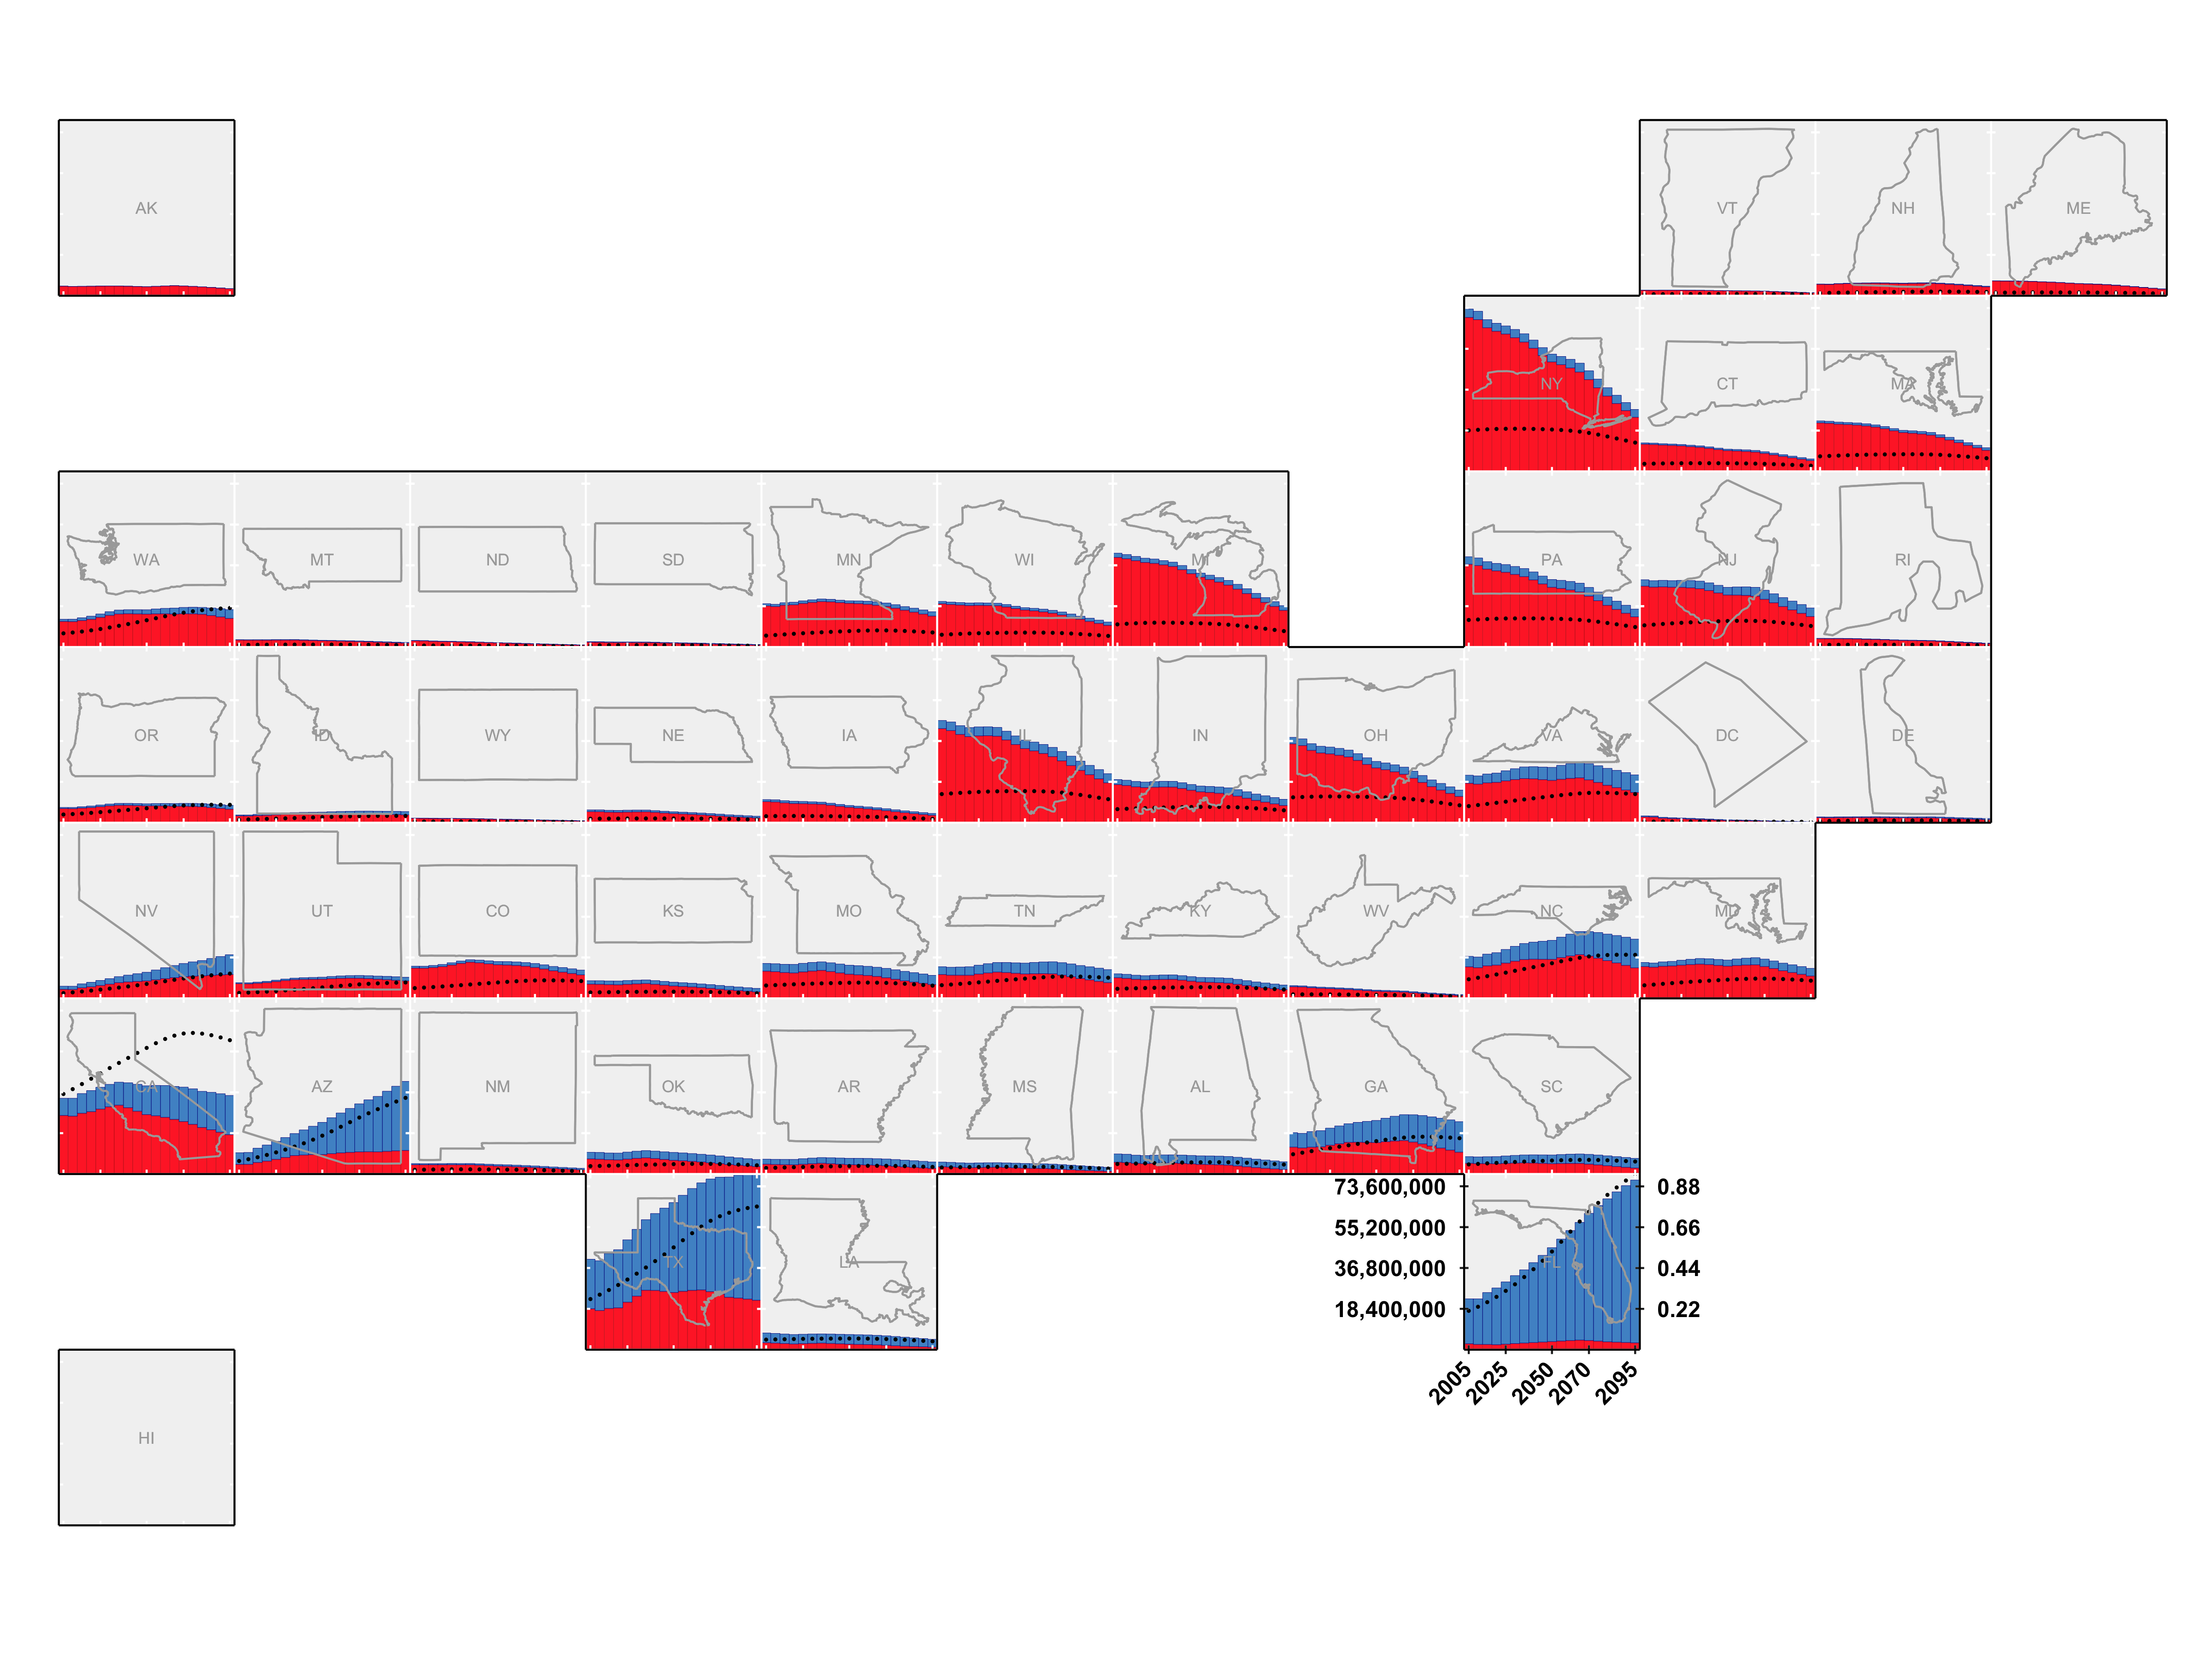
Visualizing data example
Understanding One Sample Proportion Tests
What are the differences from what we’ve previously learned? (Q8-Q11)
\(z = \frac{\hat{p} - p }{\sqrt{\frac{p(1-p)}{n}}} = \frac{0.5 - 0.48}{\sqrt{\frac{0.48(1-0.48)}{1041}}} = 1.292\)
If we are estimating the proportion with data, why are we using the z-distribution?
\(z = \frac{\hat{p} - p }{\sqrt{\frac{p(1-p)}{n}}}\)
- Do we have to estimate our standard deviation under the null hypothesis?
What happens to our proportion standard deviation for different assumed means?
- First, What is the proportion standard deviation?
\(\hat{p} = \sqrt{\frac{p(1-p)}{n}}\)
Understanding np and N(1-p) rule as a check for normality (Q12-13)
For each case below
- use a number line from 0 to 1.
- Calculate your standard devation of p.
- Use the p and standard deviation of p to draw the normal curve on your number line.
- Case 1: n = 25 and p = 0.975
- Case 2: n = 400 and p = 0.975