Welcome to class!
Spiritual Thought
- Isaiah 3 and the One Ring
Announcements
- Coding Challenge Thursday
Prepping data for the Machine

Building a Decision Tree
import pandas as pd
import altair as alt

from sklearn.model_selection import train_test_split
from sklearn.tree import DecisionTreeClassifier
from sklearn import metrics
# %%
# Load data
dwellings_ml = pd.read_csv("https://github.com/byuidatascience/data4dwellings/raw/master/data-raw/dwellings_ml/dwellings_ml.csv")

#%%
# Separate the features (X) and targets (Y)
x = dwellings_ml.filter(["livearea","basement","stories","numbaths"])
y = dwellings_ml[["before1980"]]

#%% Split the data into train and test sets
x_train, x_test, y_train, y_test = train_test_split(x, y)
#%%
# Create a decision tree
classifier_DT = DecisionTreeClassifier(max_depth = 4)

# Fit the decision tree
classifier_DT.fit(x_train, y_train)

# Test the decision tree (make predictions)
y_predicted_DT = classifier_DT.predict(x_test)

# Evaluate the decision tree
print("Accuracy:", metrics.accuracy_score(y_test, y_predicted_DT))
Understanding Your Model
Visualizing decision trees
- From the readings: A visual introduction to machine learning
- How to visualize a decision tree in python
#%%
from sklearn import tree
import matplotlib

#%%
# method 1 - text
print(tree.export_text(classifier_DT))

#%%
# method 2 - graph
tree.plot_tree(classifier_DT, feature_names=x.columns, filled=True)
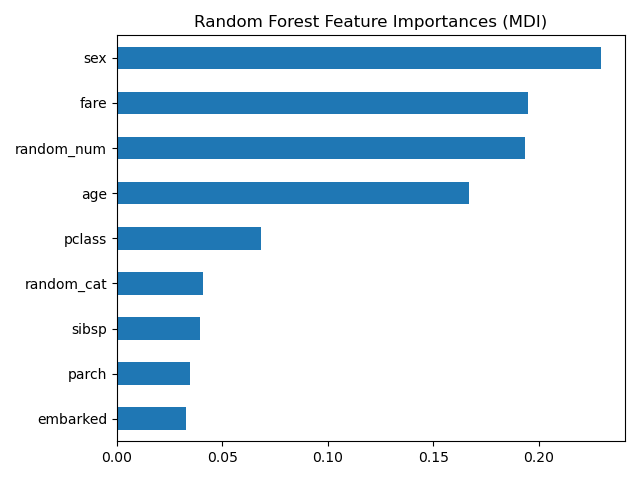
Plotting feature importance
Feature importance refers to techniques that assign a score to input features based on how useful they are at predicting a target variable. (link)
What do we need from our model to create this plot?
#%%
# Feature importance
classifier_DT.feature_importances_

#%%
feature_df = pd.DataFrame({'features':x.columns, 'importance':classifier_DT.feature_importances_})
feature_df
Evaluating model performance
Do your reading!
Read How to evaluate your ML model and try googling other ideas.
Accuracy
Problem 2 is looking for a model that has “at least 90% accuracy”.
Confusion Matrix

A confusion matrix is a quick way to see the strengths and weaknesses of your model. A confusion matrix is not a “metric”. A confusion matrix provides an easy way to calculate multiple metrics such as accuracy, precision, and recall.
Your turn: Look at the confusion matrix for our Decison Tree model. Where the model is doing well and where it might be falling short?
#%%
# a confusion matrix
print(metrics.confusion_matrix(y_test, y_predicted_DT))

#%%
# this one might be easier to read
print(pd.crosstab(y_test.before1980, y_predicted_DT, rownames=['True'], colnames=['Predicted'], margins=True))

#%%
# visualize a confusion matrix
# requires 'matplotlib' to be installed
metrics.plot_confusion_matrix(classifier_DT, x_test, y_test)