Read the project overview and Questions for understanding.
- Our 2-week project details
- Questions?
It might not be 80% but cleaning data takes time.
Data science is frequently about doing bespoke analysis which means creating and labelling unique datasets. No matter how cleanly formatted or standardized a dataset its likely to need some work. ref
I would argue that spending time working with data. To transform, explore and understand it better is absolutely what data scientists should be doing. This is the medium they are working in. ref
Tableau on tidying data
Creating new steps for a specific set of actions keeps your flow nice and tidy. Think of your steps as folders in your filing cabinet—you organize files by their subject, making it easier to find what you’re looking for. Similarly, the steps in the flow should group a set of changes that capture a particular task. For example, cleaning up customer names might involve splitting a field, remapping a bunch of values, and applying filters on other fields to get the right customer segmentation for the output of the data source. When you keep these actions in the same step, you can add a descriptive name to help you understand the flow later on. Not only does this help you, but if you’re sharing the flow with fellow analysts, it lets them find and reference the same actions, giving them a way to easily make any edits.
Structure your project, structure your thinking
Compartmentalize and Organize your scripts and data
Structured Thinking
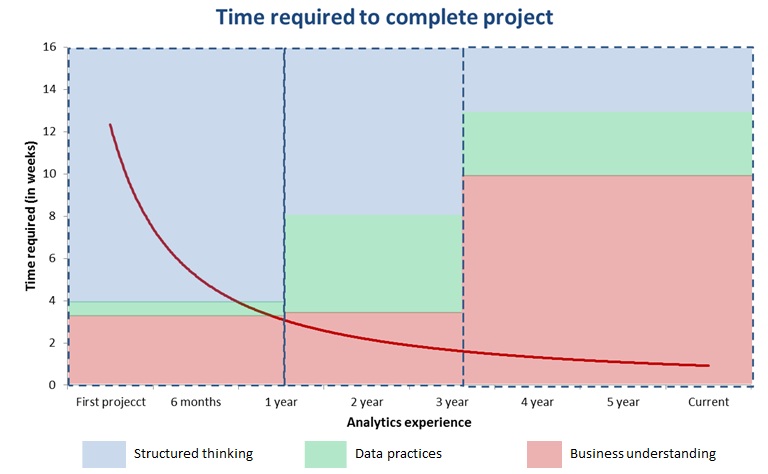
Here is how to read this graph:
- Red line in the graph shows how time to complete a project (in weeks) has come down with experience
- With in each of three blocks (< 1 year; 1 – 3 year; 3+ years), the area of color shows the factor responsible for drop in time.
- For example, during the first block, time required to complete the project comes down from 12+ weeks to 3 weeks and 75% of this drop is because of structured thinking. ref
Let’s load the data
# %%
import pandas as pd
import altair as alt
import numpy as np

url = 'https://github.com/fivethirtyeight/data/raw/master/star-wars-survey/StarWars.csv'

dat = pd.read_csv(url)
What are codecs and encodings?
Take the time to describe how the current data is organized.
- What does each row represent?
- What does each column represent?
What do we want our columns to look like to use ML?
What do we want each row to represent?
- We want shorter column names.
- We want responses in the columns.
- We need to one-hot-encode binary responses.
- We need to create numeric values out of some of the category columns.
Where are the column names?
How could we create our column names?
- Use arguments of
pd.read_csv() - Use
.melt() - Leverage the
.replace()method with a dictionary.
How might we clean up the Unnamed columns?
{'Unnamed: \d{1,2}':np.nan},