Investigating Machine Learning Models
Applied data scientists make their mark by justifying a machine learning model.
<>
- We ‘justify’ the model algorithm.
- We ‘justify’ the model fit.
Justify a model algorithm
We are focusing on supervised learning. There is another space of machine learning focused on unsupervised learning.
How many supervised ML models does scikit-learn have?
- 17 different categories
- Many different ‘model algorithms’ under each category. Each algorithm has a high-level summary with a simple example.
- Linear Models has at least 17 and represents the set of methods I was familiar with after a graduate degree in statistics.
- Ensemble methods has at least eight algorithms. We want to use the Gradient Tree Boosting.
What are boosted algorithms, and why would we use them?
This is the beginning of the rabbit hole. We could have weeks of class on each algorithm (ref). It works well. Let’s settle on that for now.
How would I compare two different algorithm’s performance?
I would use the output from the model fit for each to compare performance.
Justify model fit
What does model fit mean?
Model fitting is a measure of how well a machine learning model generalizes to similar data to that on which it was trained. A model that is well-fitted produces more accurate outcomes. A model that is overfitted matches the [sample] data too closely. A model that is underfitted doesn’t match [either the sample data or the population] closely enough. ref
While statisticians can be data scientists and data scientists can be statisticians. The below description generalizes how justification happens.
Statisticians justify: Comparing sample data to parametric fit assumption (math principles that explain the inference from the data) - for example, normality of errors, independence, linearity.
Data Scientists justify: Comparing the predictions from our model to the measured values (Results-oriented justification that supports inference). Data scientist justification depends on training and testing sample data. The inference process explains metrics like correlation or precision on the testing sample data to justify the results.
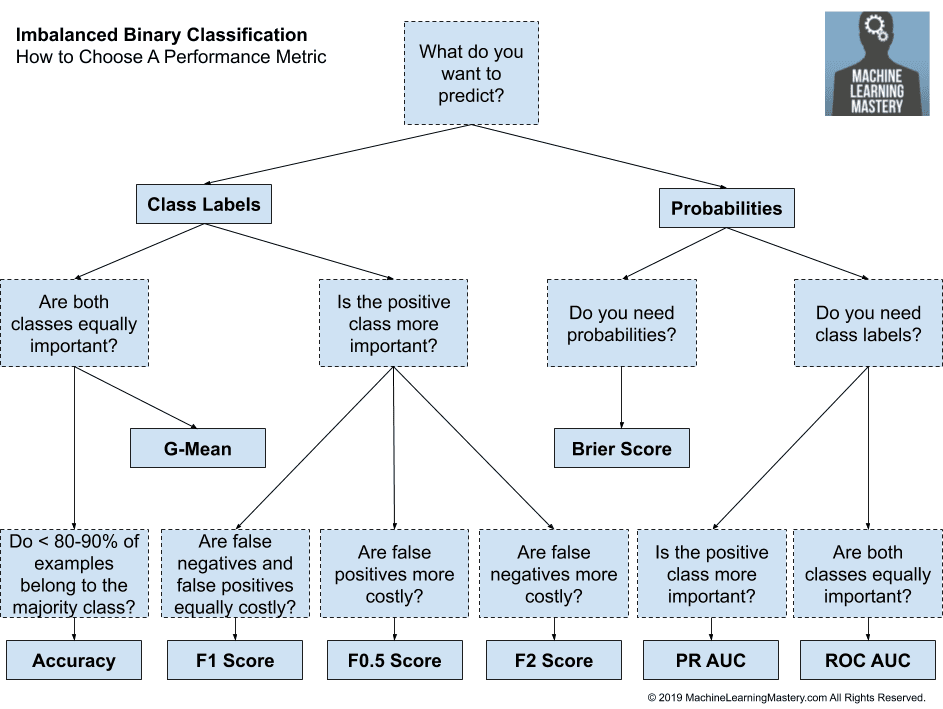
What metrics should we use?
The confusion matrix
Take a second and write a short sentence describing where the model is doing well and where it might be falling short?
print(metrics.confusion_matrix(y_test, predict_p))
metrics.plot_confusion_matrix(classifier, X_test, y_test)
Orienting the TRUE and PREDICTED


sklearn.metrics descriptions
Everything evolves from the confusion matrix
Can we create the classification report?
from sklearn.metrics import classification_report
ROC Curves
Use the code from the following link to build a ROC curve for our data.
- How to Use ROC Curves and Precision-Recall Curves for Classification in Python
- sklearn.metrics.roc_curve()
metrics.plot_roc_curve(clf, X_test, y_test)
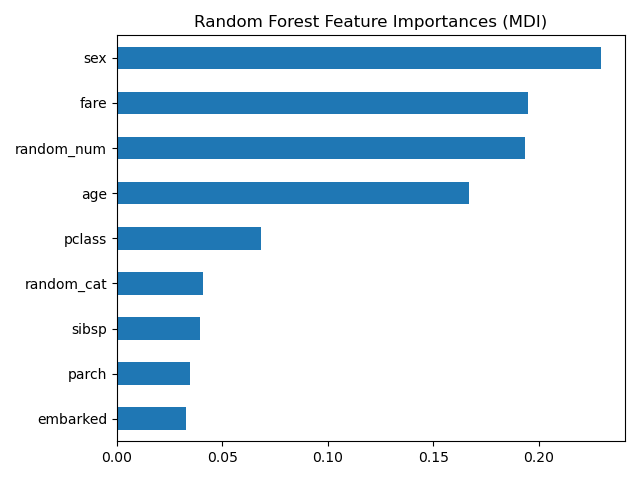
What is feature importance?
What variables had the most impact on the model?
- Build a
pd.DataFrame({})with the top 12 variables and their feature importance.- Create a feature importance bar chart with the most important feature sorted to the top.
What do we need from our model to create this plot?
df_features = pd.DataFrame(
    {'f_names': X_train.columns,
    'f_values': clf.feature_importances_}).sort_values('f_values', ascending = False)