Altair Visualization
We will be using Altair in our course. It is a declarative visualization package in Python that is based on Vega-Lite which leverages the grammar of graphics.
- User Guide
- Data Visualization Curriculum or the Quarto version https://jjallaire.github.io/visualization-curriculum/)
- P4DS Data Visualization Chapter
Rendering Altair Charts in Quarto
We use Quarto to render Altair images automagically into our HTML reports. The process should simply work. However, read in the following section if you need to export one of your images as a .png or another image format.
Saving Altair Charts
Just installing altair and altair_saver will not allow you to leverage the .save() method to save your chart. The javascript visualization you see in your interactive python window needs additional external applications to allow .save('chart.png') to work.
We will go through a few ways for us to save our Altair plots.
1. Saving altair plots programmatically
Let’s say we want to save the above plot as a PNG file. Assuming we have already installed the altair library, we need to install the altair_saver.
1.1 Installing the altair_saver
Within your interactive python window execute the following command.
import sys
!{sys.executable} -m pip install altair_saver
1.2 Additional tool for saving plots
We suggest NodeJS path. However, you are more than welcome to study Selenium for further understanding. The Github repository for altair_saver, the developers exclusively told us to install additional tools.
NodeJS Installation
- Install the NodeJS for your platform
- Run the following in your Terminal (Mac) or PowerShell (Windows) to install all the packages we need from NodeJS.
npm install -g vega-lite vega-cli canvas
M1 Mac Altair Solution
- Install selenium using the chromedriver package form this link: https://chromedriver.chromium.org.
- Unzip the file and move the file to your chrome path
/usr/local/bin/chromedriver
See the selenium_fix.py script for an example.
Note: This process will run a local server on your computer that opens the chart as an PNG file in chrome and downloads the file to the folder in which that VSCode file is located on your computer.
1.3 Saving a plot using altair_saver
It might require you to restart VScode and import everything again for this to work. Please note that the plot will be saved in the same folder of the script.
chart = alt.chart(<data>).<chart_methods>
chart.save('name_of_chart.png')
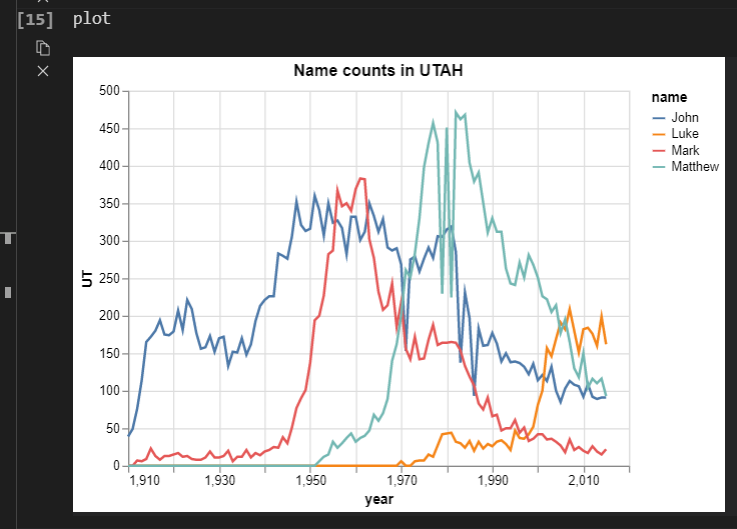
2. Save as PNG method
The method only requires us to have Altair library. Whenever we output a plot, we will see a button with three dots at the top right corner of the plot.
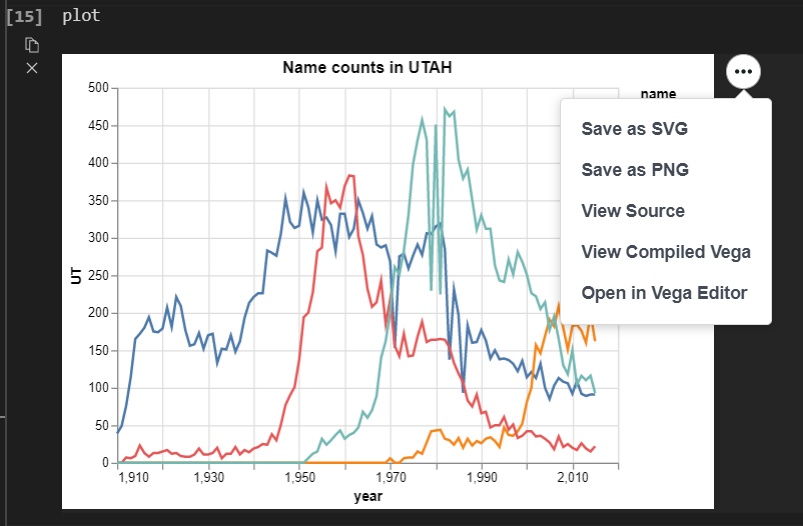
Clicking Save as PNG will bring us to a window to save our plot.
3. Screenshot method
If all thing fails and we need to save a plot, the snip & sketch (Windows) or taking a screenshot (MacOS) will be our last resort.