Visual Crit
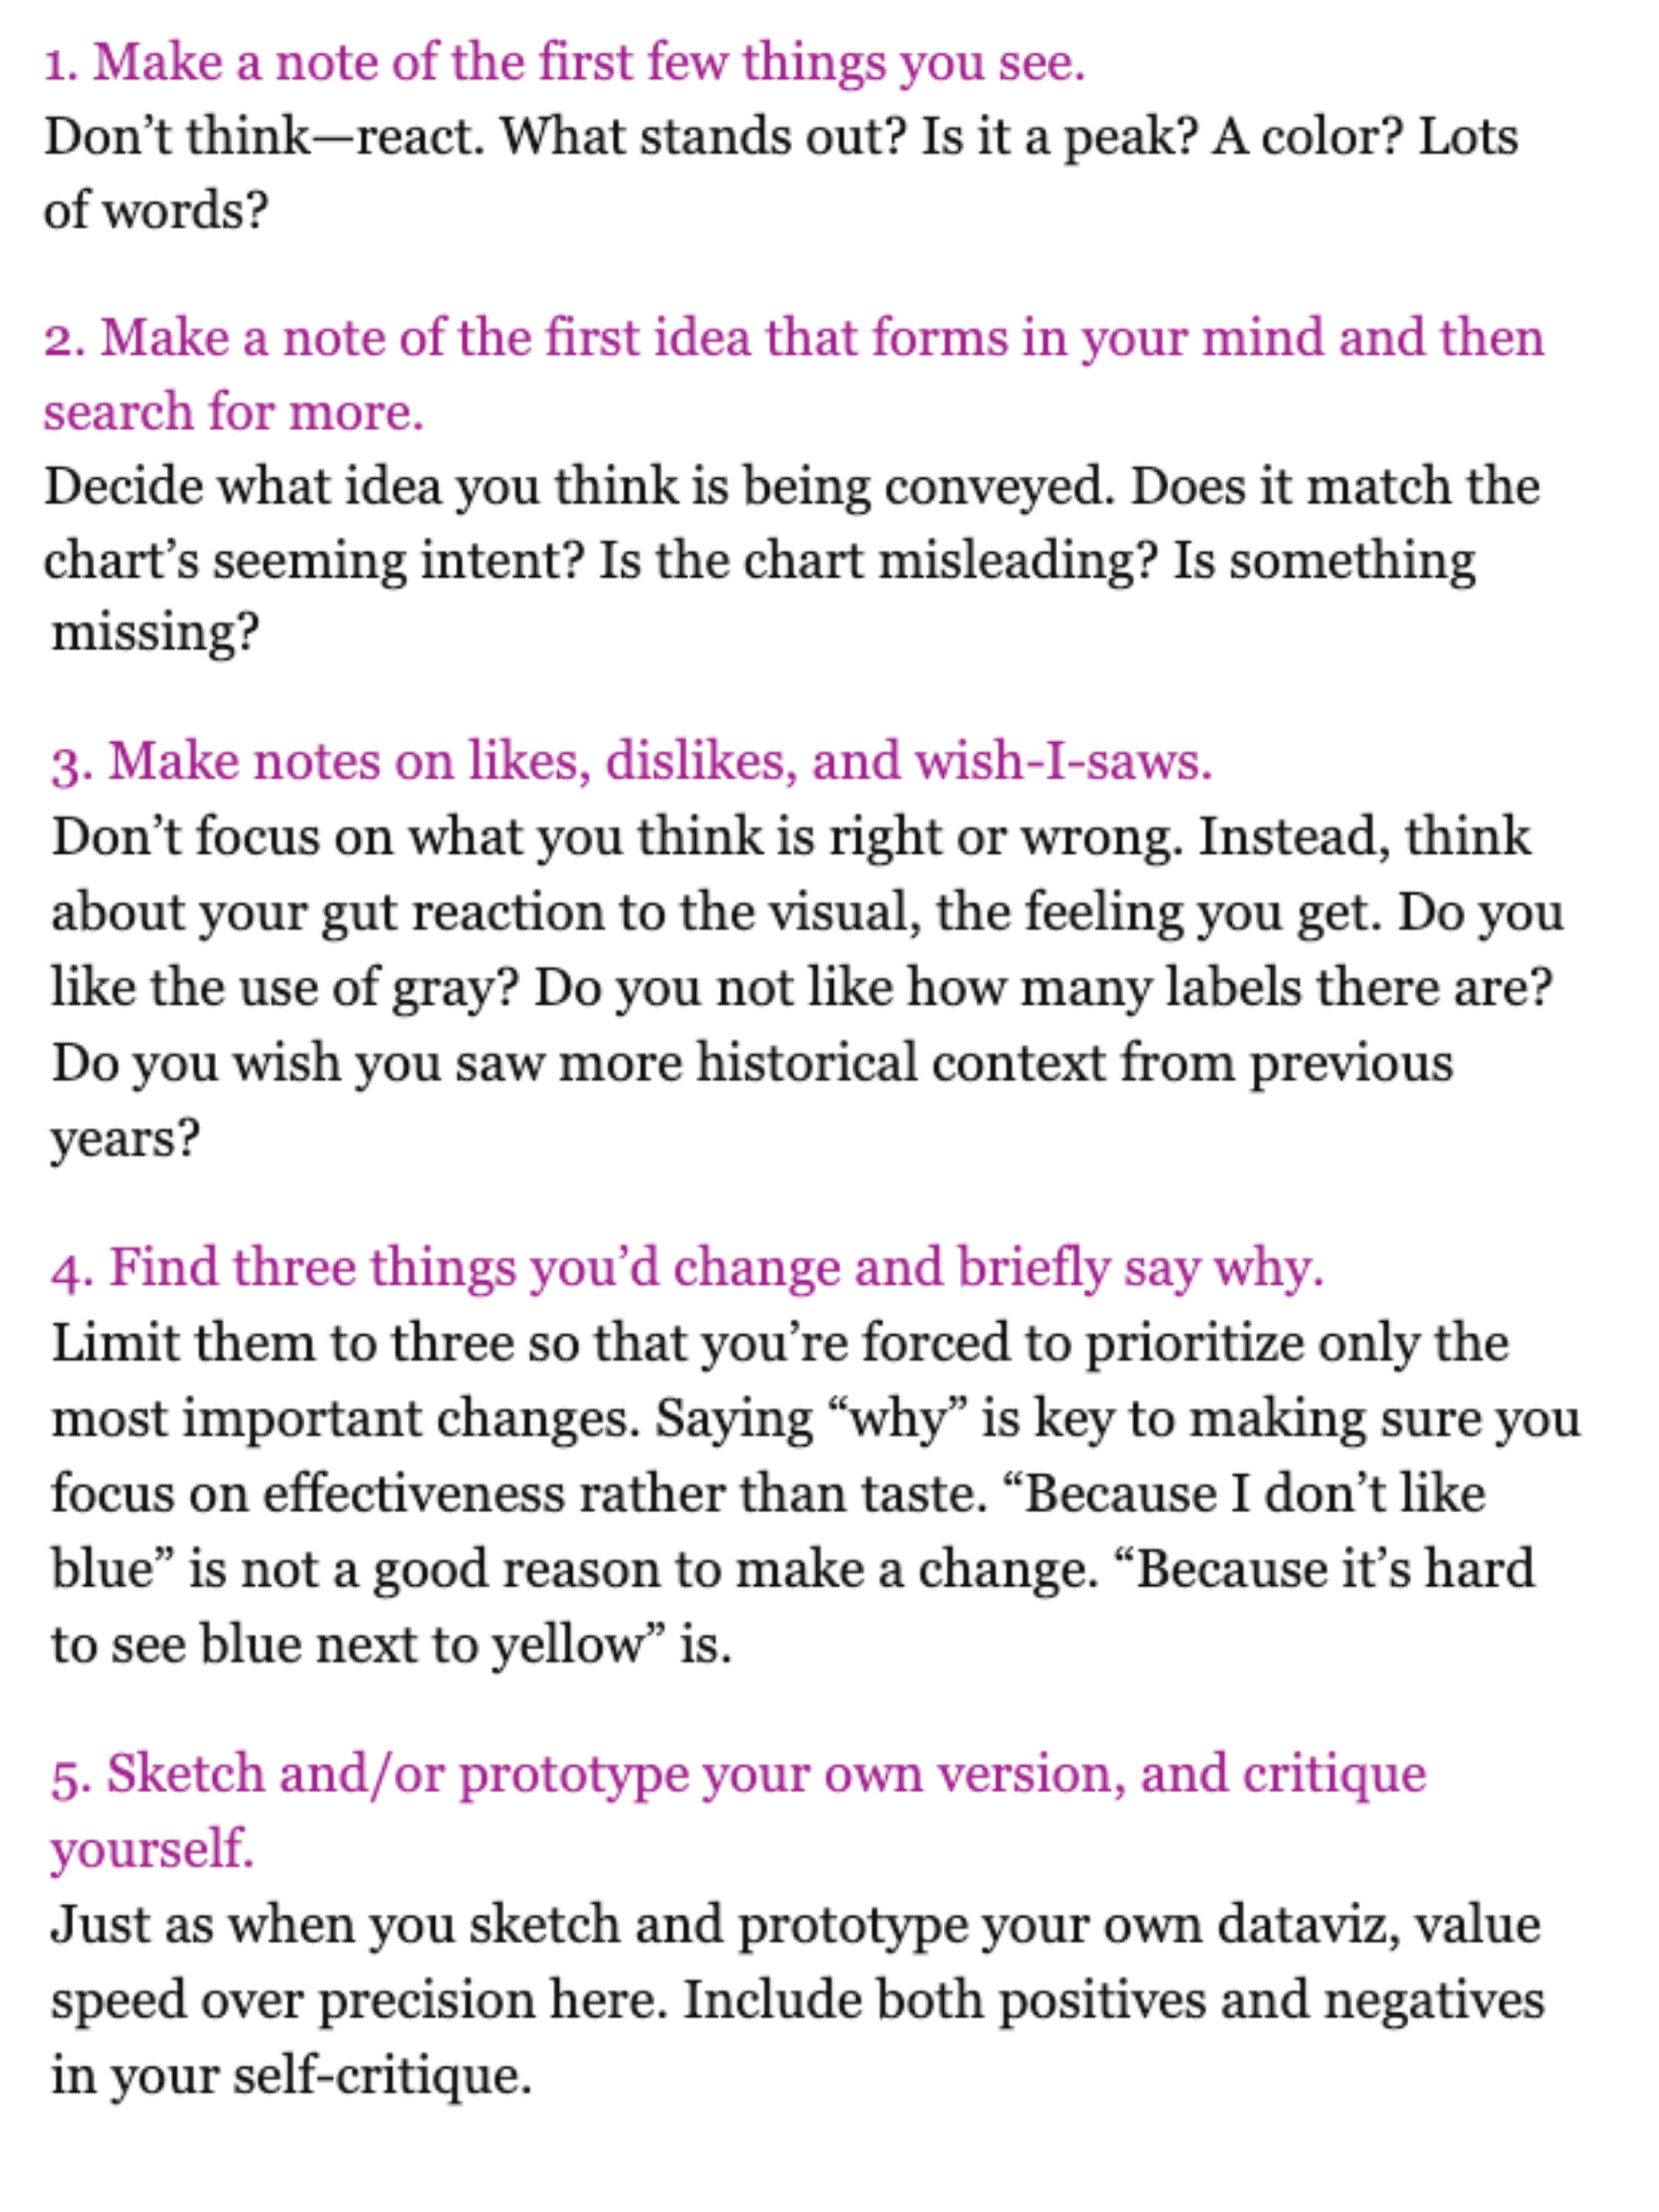
- Make a note of the first few things you see.
- Make a note of the first idea that forms in your mind and then search for more.
- Make notes on likes, dislikes, and wish-I-saws.
- Find three things you’d change and briefly say why.
- Sketch and/or prototype your own version, and critique yourself.
Link to book text
- A messy data set that requires you to describe its issues and what you would do to clean it up for use in visualization.
- A data journalism article review where you identify the strengths and weaknesses of the visualizations used to tell their story.
- A visualization request to be done in Tableau with the data set that we provide.
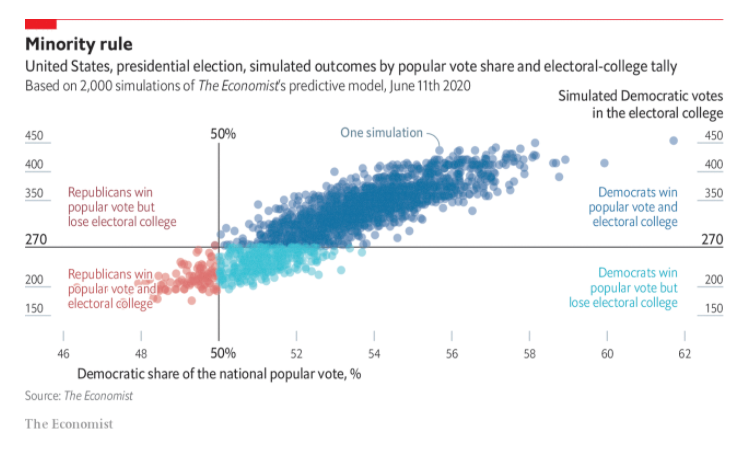
Let’s work through the steps together.
![]()
Challenge Questions
- Make a note of the first few things you see.
- Write a short description of the message of the chart (you can come back to this)
- Note 2-3 likes, 2-3 dislikes, and 2-3 wish-I-saws.
- Explain the changes you would make on your 2-3 dislikes and the reason for the changes.
- Sketch and/or prototype your own version, and write a 3-4 sentence paragraph critique of your prototype.
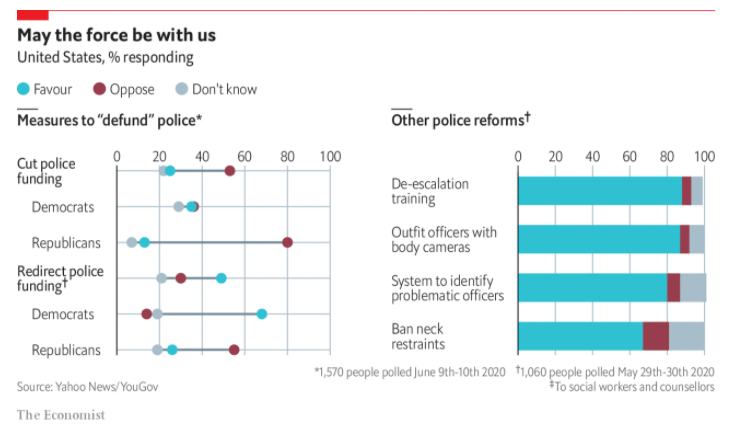
Work through the left chart on your own (15 minutes).
![]()
Practice Your Crit Skills