Presenting Charts
Good Reads
Chapter 8: Present to Persuade (Pg. 177-192)
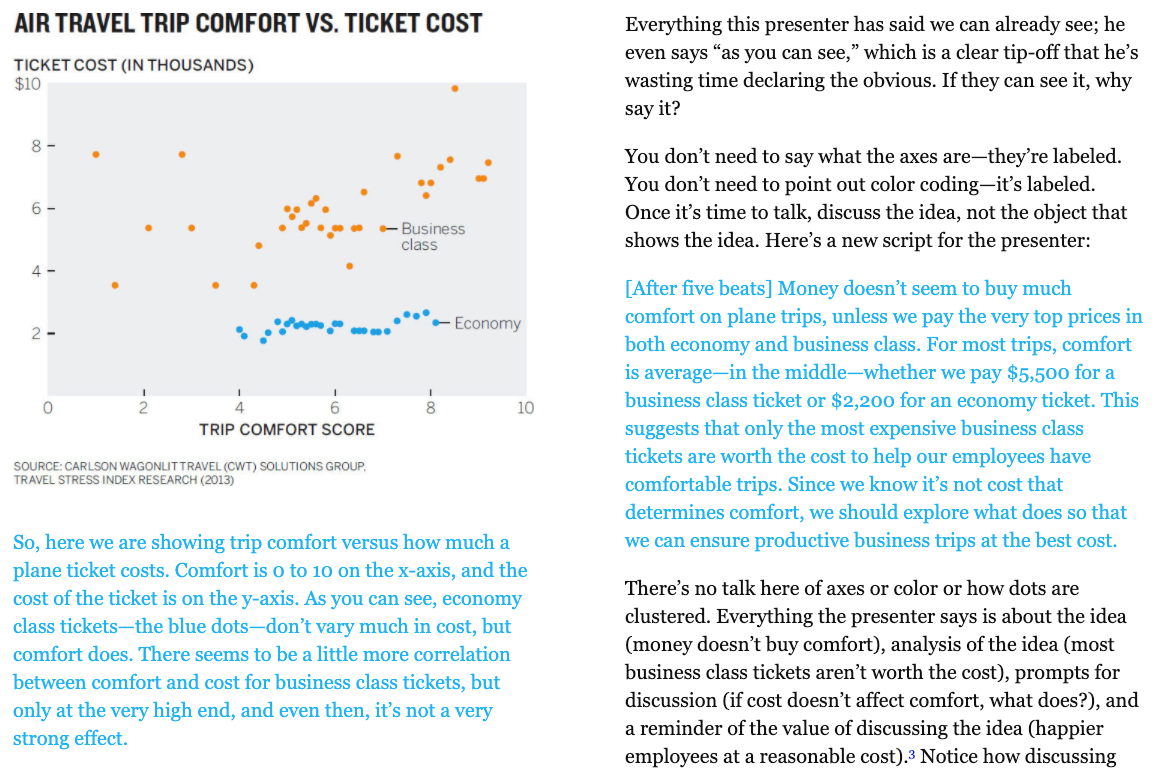
When it’s time to talk, don’t read the picture.

Hans Rosling’s Idea Discussion
Vox’s Chart discussion
I worry that Scott has oversold not explaining the chart
- What are your thoughts?
Case Study
Why does height measure health?
- Let’s plot each child’s height by their age.
- What can we discern about each child?
- What can we discern about each country?
Understanding Z-scores
- How can Z-scores be a measure of health?
\[Z = \frac{x - \mu}{\sigma}\]
Let’s check the z-score calculations of our data
- Calculated Fields
- Plotting LAZ by agedays
Children’s heights
One slide should explain what a z-score is and how it is calculated for our graphics.
One slide should show height adjusted z-scores (HAZ) for a few healthy and a few unhealthy children from each gender over all the times using the MAL-ED data.
1-2 Slides about the health of the children at 365 days (1-year) for multiple countries.
- One chart should show the distribution of heights for children from at least 4 countries at ~365 days.
- One chart should have visualizations of the health of the children at ~365 days for each country (height adjusted z-scores).
Take the time to explain your concerns about the health of the children of the study based on their z-scores.
One slide should show a plot of the heights of the dutch children over time. Take the time to describe the key takeaways about their growth.