Spatial Data: Maps
Outline
Discuss tidy data
Review Good Reads (Refining to persuade)
Highlight visualizing data with maps
Work on projects
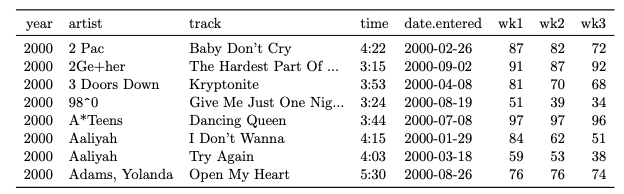
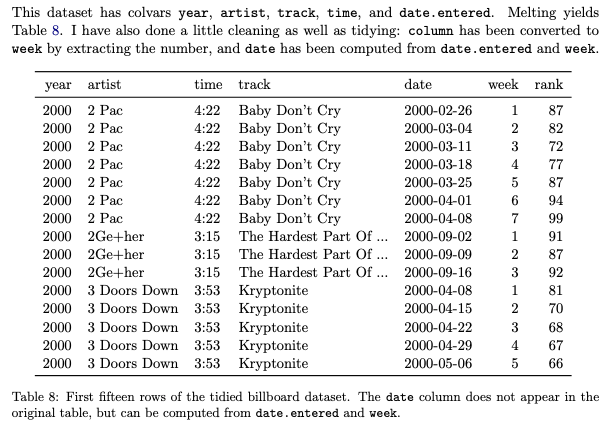
Tidy data
In tidy data:
Each variable forms a column.
Each observation forms a row.
Each type of observational unit forms a table.
Five most common problems
Column headers are values, not variable names.
Multiple variables are stored in one column.
Variables are stored in both rows and columns.
Multiple types of observational units are stored in the same table.
A single observational unit is stored in multiple tables.
Tidy data ensures that values of different variables from the same observation are always paired.
Good Reads
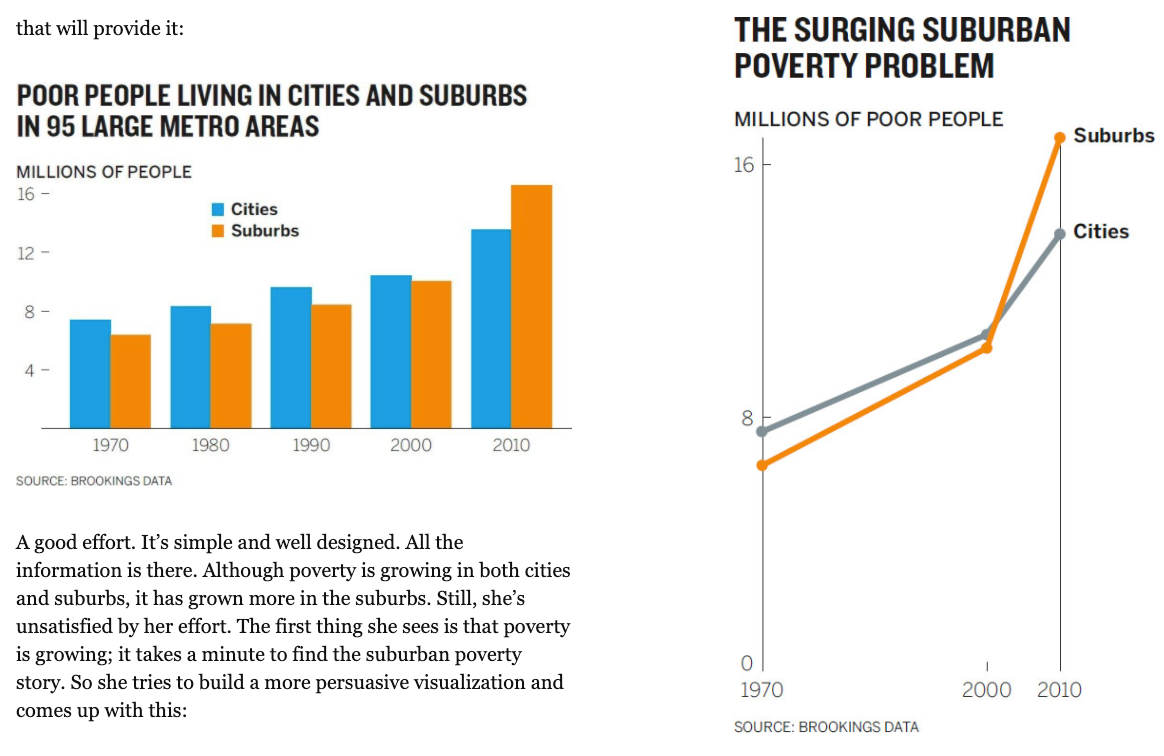
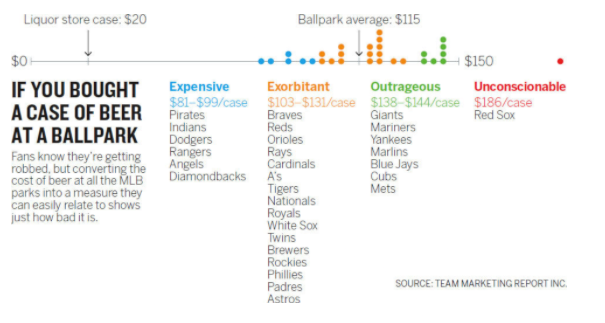
Chapter 6: Refine to Persuade (pgs. 133-142)
You are trying to reveal truths dormant in the data; to make a case; compete for attention.
It is often the [data scientists] job to
show
all the data - to be as objective as possible.
Data presentation
Data analysis
Persuasion with data
We decided that architecture, analytics, and visualization are all equal players.
Chapter 6: Line Charts vs. Bar Charts
Chapter 6: Creating the thinking unit
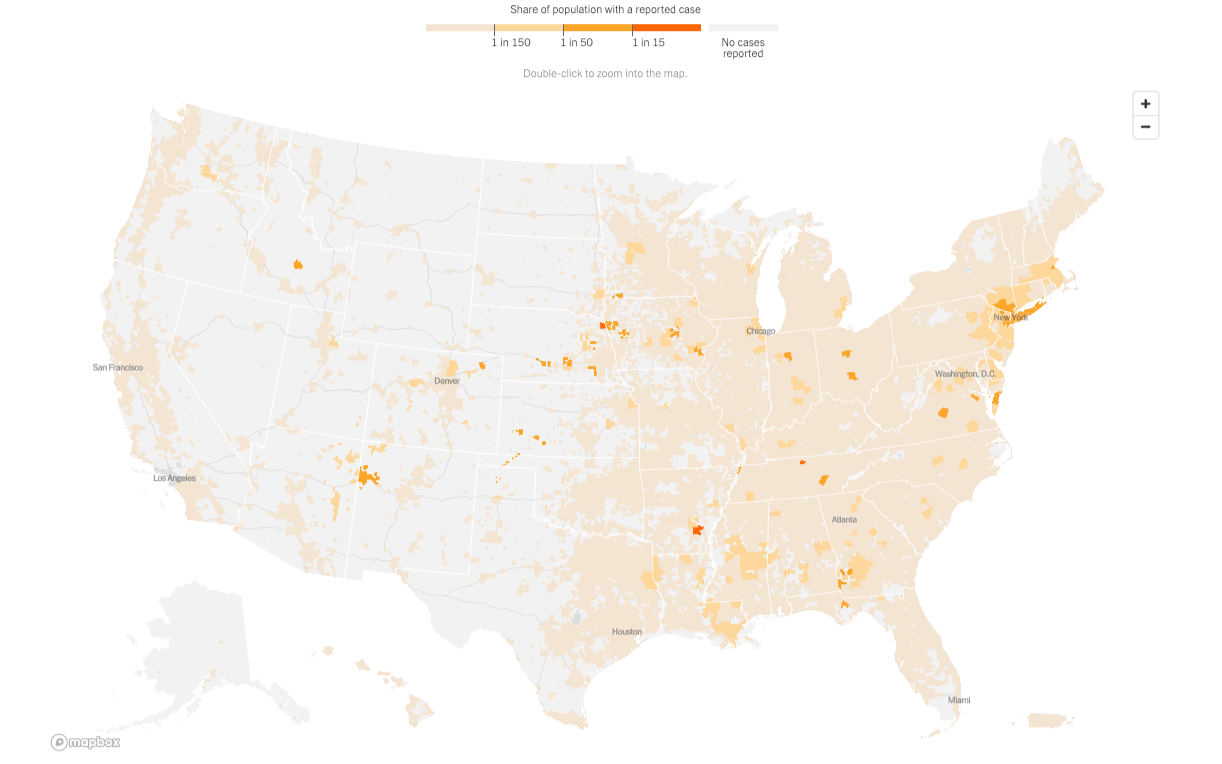
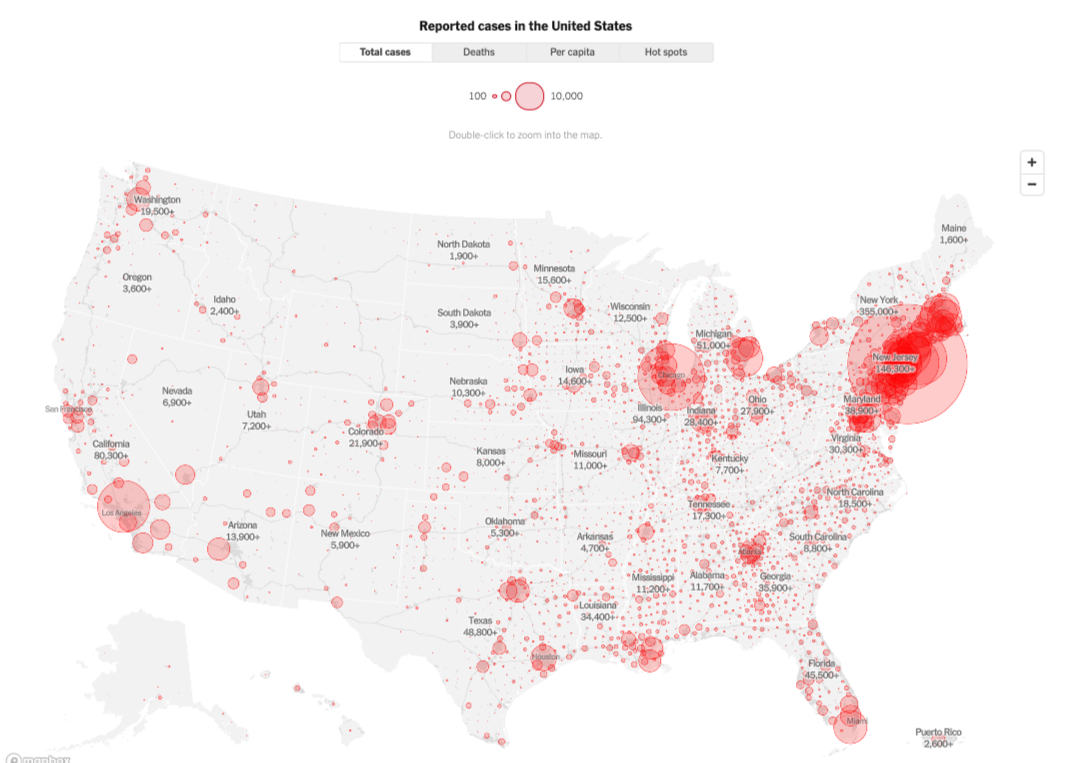
Visualizating variables on maps
Using geographic region chloropleths
Using dots
Making maps in Tableau
Get Started Mapping with Tableau
Multiple data sets in one Tableau file
Joining data sets in a Tableau file
Case Study
Data interrogation time
Can you find an interesting spatial relationship (lat, long, state, elevation) to race times?