Time Series: Line Charts
Good Reads
Chapter 5: Refine to impress (Pg. 121-132)
- A visualization is an abstraction
- Avoid the ‘belt-and-suspenders’ design
- Simple: Understanding? - Clarity? - Detail?
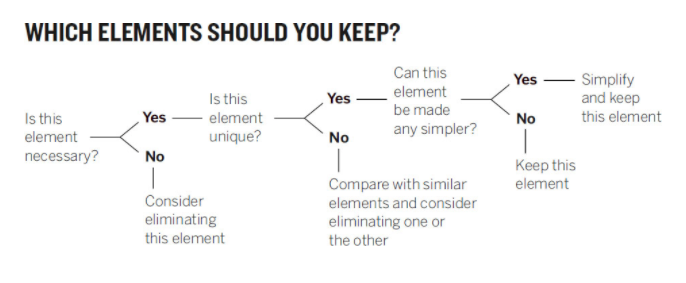
Tableau Tools
Don’t forget the tool-tips
The tools
Tools Activity
- You and a partner will take one of the following readings and build a 1-minute guide on how to use that option.
- You get 5 minutes to review and prep the guide.
- Each of you will present your 1-minute guide to the class.
Using Shelves and Cards
- The Columns shelf creates the columns of a table (x-axis), while the Rows shelf creates the rows of a table (y-axis). You can place any number of fields on these shelves.
- Right-click (control-click on Mac) the row or column you want to hide, and then select Hide.
- Open the field menu for a field that has hidden columns or rows and select Show Hidden Data.
- The Pages shelf lets you break a view into a series of pages so you can better analyze how a specific field affects the rest of the data in a view.
- Measure Values and Measure Names
- Summary Cards
Changing the mark or geometry of the graphic
This is where we change the geometries shown on the page.
Editing the marks or geometry
Reference Lines, Bands, Distributions, and Boxes
Check out the Analytics (much more like data summaries tab) next to Data.